标签:
clc,clear
x=[11.9,11.5,14.5,15.2,15.9,16.3,14.6,12.9,15.8,14.1];
y=[196.84,196.84,197.14,197.03,197.05,197.13,197.04,196.96,196.95,196.98];
plot(x,y,‘.‘)

U
V
R=V./(U+V)
%图形展示出来
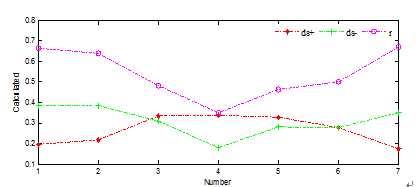
x=[1 2 3 4 5 6 7];
plot(x,U,‘-.R*‘,‘LineWidth‘,2);
hold on;
plot(x,V,‘-.G+‘,‘LineWidth‘,2);
hold on;
plot(x,R,‘-.Mo‘,‘LineWidth‘,2);
%hold on;
%grid on;
xlabel(‘Number‘);
ylabel(‘Recognition rate (%)‘);
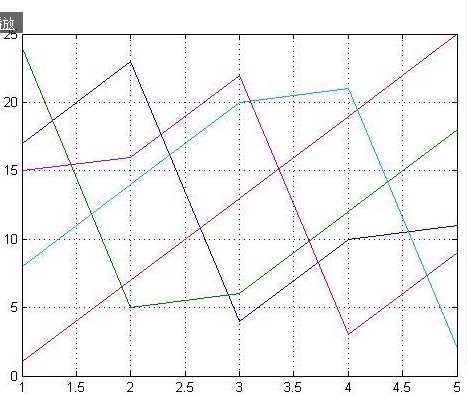
matlab:对单个矩阵plot绘图的说明
实例:a=magic(5)
a =
17 24 1 8 15
23 5 7 14 16
4 6 13 20 22
10 12 19 21 3
11 18 25 2 9
plot(a)
grid on
x=rand(10,1,40); % 随机取40个数 一个当横坐标 一个当纵坐标
y=rand(10,1,40);
%画图
plot(x( 1:10),y( 1:10),‘r.‘);hold on; % 点    r=红色
plot(x(11:20),y(11:20),‘g*‘);hold on; % 星星  g=绿色
plot(x(21:30),y(21:30),‘o‘);hold on;  % 圆圈  默认是蓝色
plot(x(31:40),y(31:40),‘mo‘,‘MarkerSize‘,15) % 大大的圆圈  m=紫色

标签:
原文地址:http://www.cnblogs.com/wangh0802PositiveANDupward/p/4944898.html