标签:
//@樵夫上校: 0. 经验上,10X规则(训练数据是模型参数量的10倍)适用与大多数模型,包括shallow network. 1.线性模型可以应用10X的经验规则,模型参数是特征选择后的数量(PCA等方法)。2.NN可以将10X规则当做训练数据量的下限。

The quality and amount of training data is often the single most dominant factor that determines the performance of a model. Once you have the training data angle covered, the rest usually follows. But exactly how much training data do you need? The correct answer is: it depends. It depends on the task you are trying to perform, the performance you want to achieve, the input features you have, the noise in the training data, the noise in your extracted features, the complexity of your model and so on. So the way to find out the interaction of all these variables is to train your model on varying amounts of training data and plot learning curves. But this requires you to already have some decent amount of training data to construct interesting plots. What do you do when you are just starting out? Or when you suspect you have too little training data and want to estimate how big a problem you are in?
So instead of the dead accurate “correct” answer to the problem, how about an estimate, a practical rule of thumb? One way out is to take an empirical approach as follows. First, automatically generate a lot of logistic regression problems. For each generated problem, study the relationship between the amount of training data and the performance of the trained models. Observing this relationship over a range of problems, generalize to a simple rule.

Here is the code to generate a range of logistic regression problems and study the effect of varying the amount of training data. The code is based onTensorflow. Running the code doesn’t require any special software or hardware (Tensorflow is open sourced by Google), and I was able to run the entire experiment on my laptop. Upon running, the code spits out the graph below.
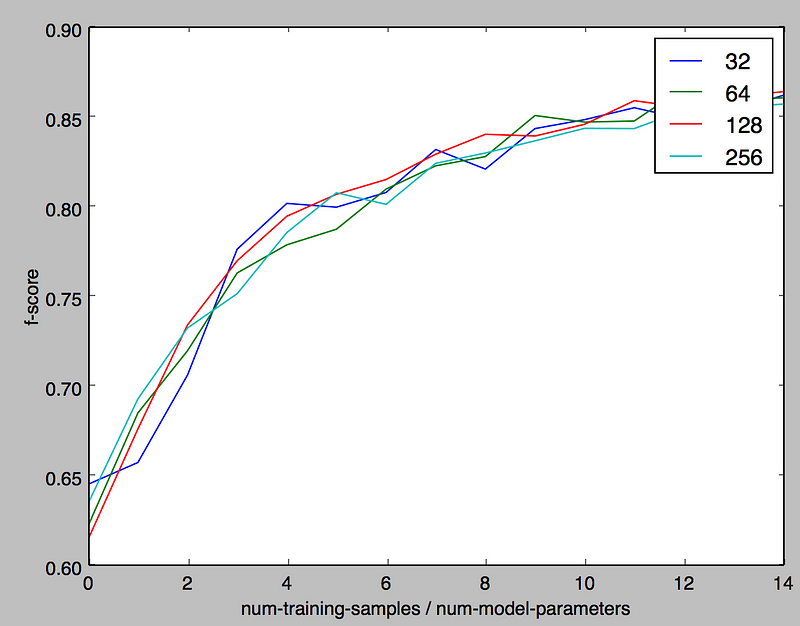
The x-axis is the ratio of the number of training samples to the number of model parameters. The y-axis is the f-score of the trained model. The curves in different colors correspond to models that differ in the number of parameters. For example, the red curve which corresponds to a model with 128 parameters indicate how the fscore changes as one varies the number of training samples to 128 x 1, 128 x 2 and so on.
The first observation is that the f-score curves don’t vary as the parameters scale. This is expected given the models are linear and it’s good to see that some hidden non-linearity doesn’t creep in. Of course, larger models need more training data, but for a given ratio of the number of training samples to the number of model parameters you get the same peformance. The second observation is that when the ratio of training samples to model parameters is 10:1, the f-score lands in the vicinity of 0.85 which we take as the definition of a well performing model. This leads us to the rule of 10, namely the amount of training data you need for a well performing model is 10x the number of parameters in the model.
The rule of 10 transforms the problem of estimating the amount of training data required to knowing the number of parameters in the model, so it deserves some discussion. For linear models such as logistic regression, the number of parameters equal the number of input features since the model assigns a parameter corresponding to each feature. However there could be some complications:
One way to tackle the issue is to observe that you don’t really need labeled data to get an estimate of the number of features, even unlabeled examples are sufficient for that purpose. For example, given a large corpus of text, you can generate histograms of word frequencies to understand your feature space before beginning to label the data for training. Given the histogram, you can discard the words in the long tail to get an estimate of the real feature count, which then gives an estimate of the amount of training data you need applying the rule of 10.
Neural networks pose a different set of problems than linear models like logistic regression. To get the number of parameters in a neural network you need to
The problem is the relationship between the parameters in a neural network is no longer linear, so the emperical study we did based on logistic regression doesn’t really apply anymore. In such cases you can treat the rule of 10 as a lower bound to the amount of training data needed.
Despite the complications above, in my experience the rule of 10 seem to work across a wide range of problems, including shallow neural nets. However when in doubt, plug in your own model and assumptions in the Tensorflow code and run the simulation to study it’s effects. Please feel free to share if you gain any insight in the process.

How much training data do you need?
标签:
原文地址:http://www.cnblogs.com/yymn/p/5005414.html