标签:
先上效果图吧(图中Tue表示周二):
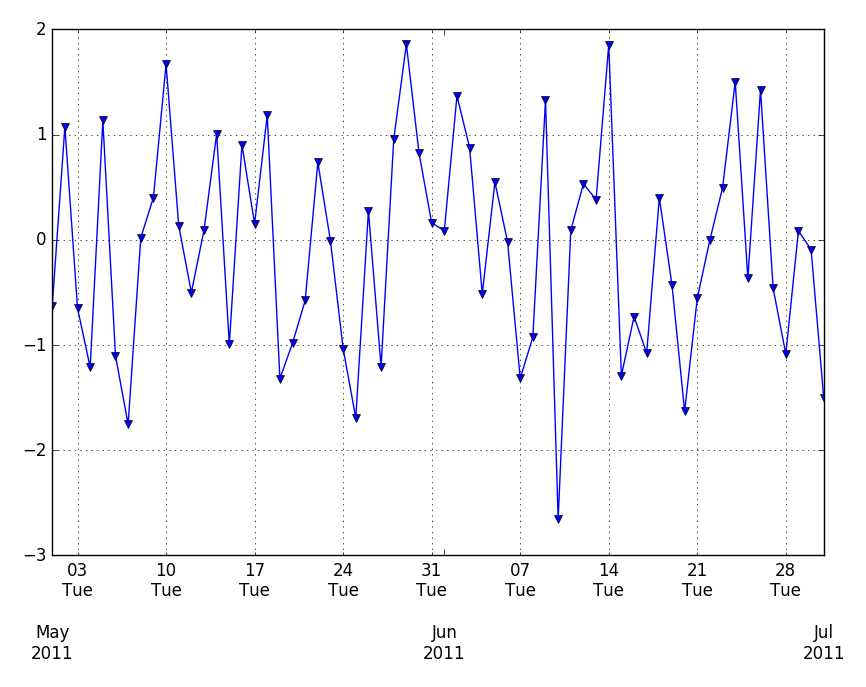
Pandas和matplotlib.dates都是使用matplotlib.units来定位刻度。
matplotlib.dates可以方便的手动设置刻度,同时pandas似乎可以自动调整格式。
直接上代码吧:
# -*- coding: utf-8 -*-
"""
Created on Tue Dec 15 10:43:01 2015

@author: vgis
"""

import numpy as np
import pandas as pd
import matplotlib.pyplot as plt
import matplotlib.dates as dates

idx = pd.date_range(‘2011-05-01‘, ‘2011-07-01‘)
s = pd.Series(np.random.randn(len(idx)), index=idx)

fig, ax = plt.subplots()
ax.plot_date(idx.to_pydatetime(), s, ‘v-‘)
ax.xaxis.set_minor_locator(dates.WeekdayLocator(byweekday=(1),
                                                interval=1))
ax.xaxis.set_minor_formatter(dates.DateFormatter(‘%d\n%a‘))
ax.xaxis.grid(True, which="minor")
ax.yaxis.grid()
ax.xaxis.set_major_locator(dates.MonthLocator())
ax.xaxis.set_major_formatter(dates.DateFormatter(‘\n\n\n%b\n%Y‘))
plt.tight_layout()
plt.show()
#参考#
标签:
原文地址:http://www.cnblogs.com/nju2014/p/5047490.html