标签:
In statistics, Moran‘s I is a measure of spatial autocorrelation developed by Patrick Alfred Pierce Moran. Spatial autocorrelation is characterized by a correlationin a signal among nearby locations in space. Spatial autocorrelation is more complex than one-dimensional autocorrelation because spatial correlation is multi-dimensional (i.e. 2 or 3 dimensions of space) and multi-directional.
Global Moran‘s I is defined as
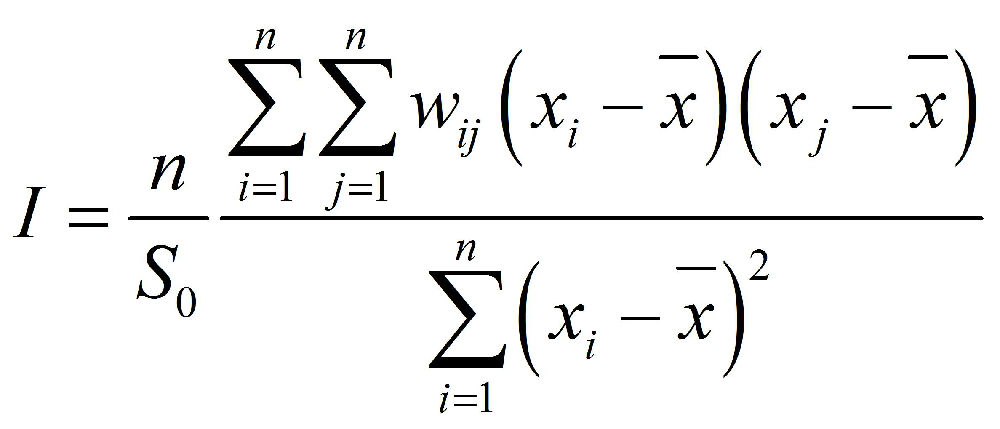
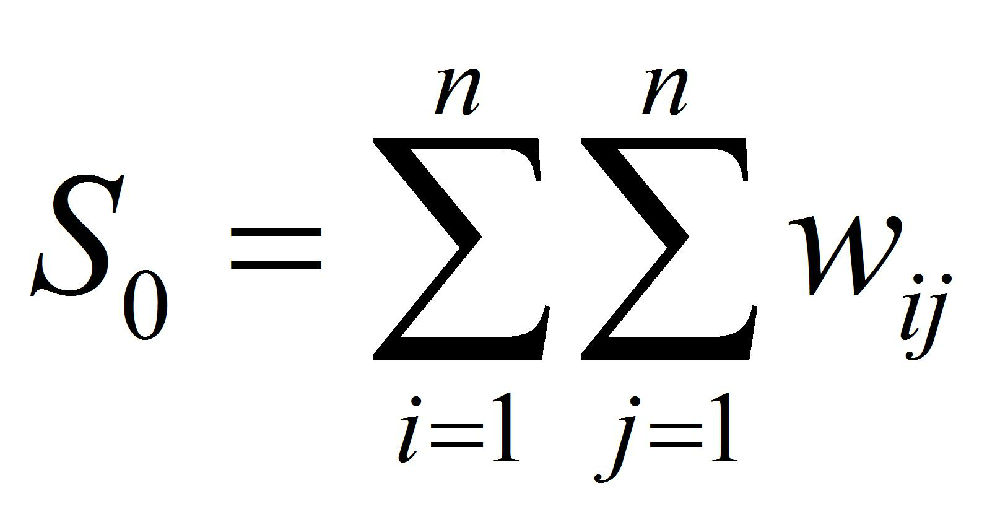
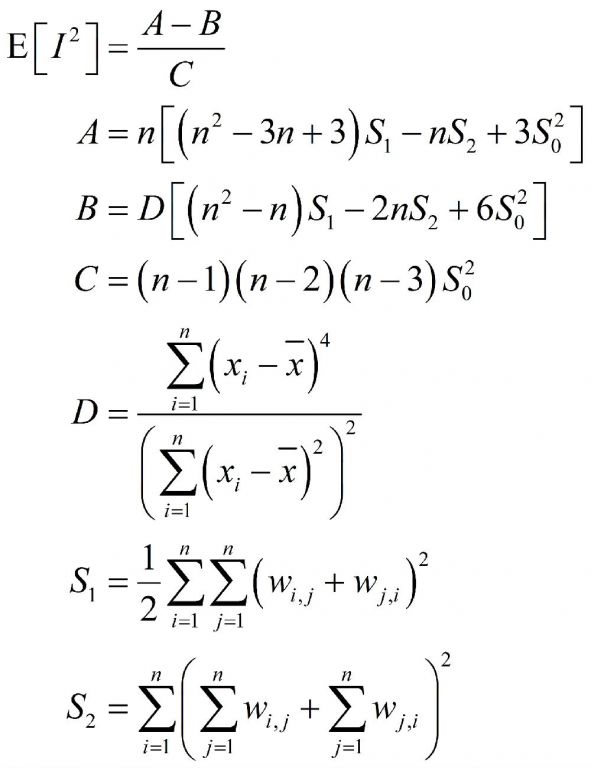
where wij is the weight between observation i and j, and S0 is the sum of all wij‘s, n is equal to the total number of pixels.:
The zI-score for the statistic is computed as:
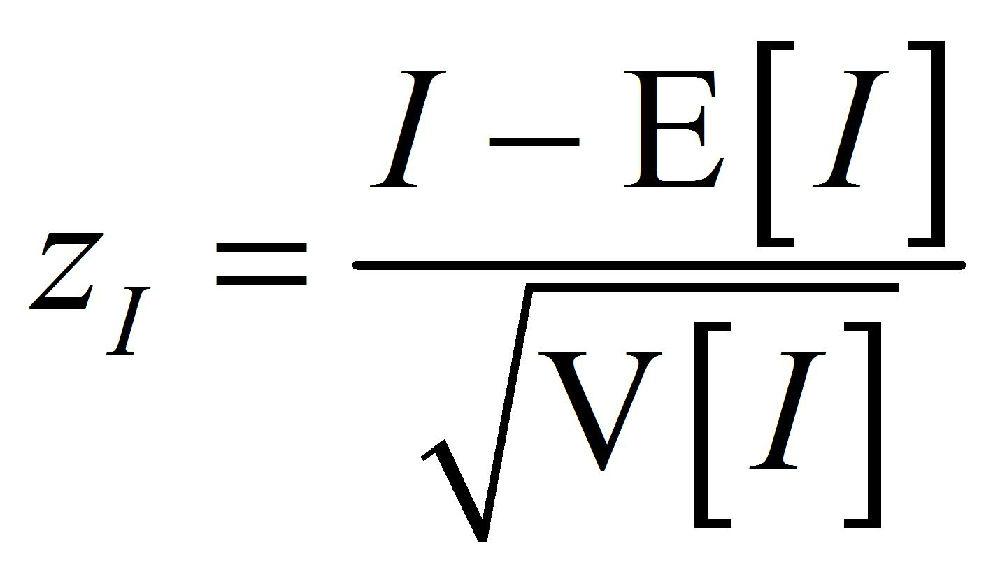
Where:
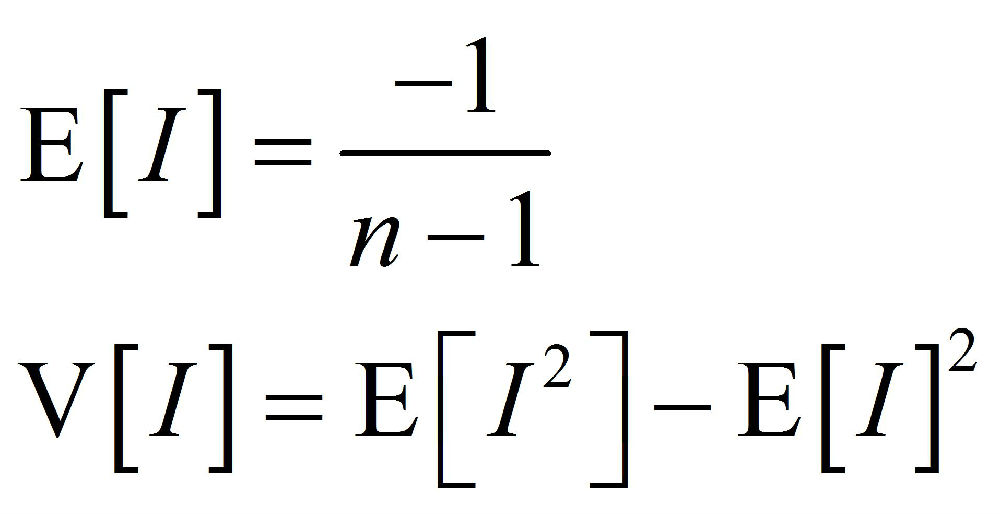
the p-value for the null hypothesis is written as
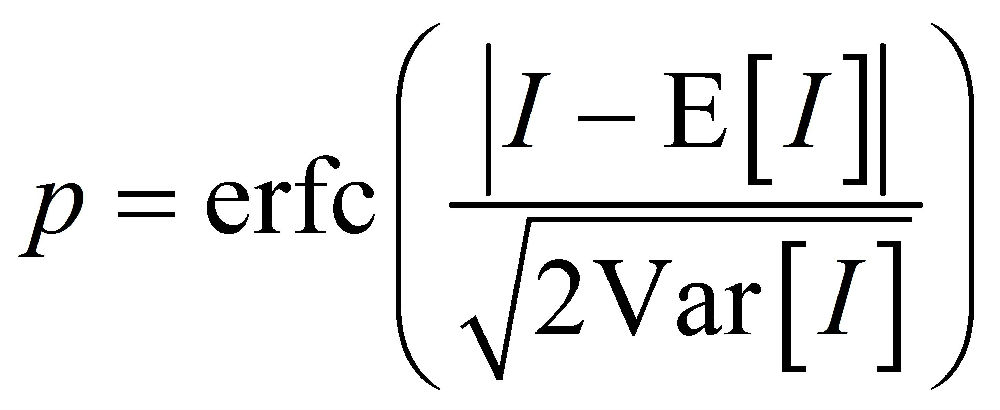
this formula sources from Aki-Hiro Sato. Applied Data-Centric Social Sciences: Concepts, Data, Computation and Theory. Japan, Springer, 2014. pp. 137-138.
Negative/positive values indicate negative/positive spatial autocorrelation. Values range from -1 (indicating perfect dispersion) to 1 (perfect correlation). A zero value indicates a random spatial pattern. For statistical hypothesis testing (the null hypothesis of no autocorrelation is not equal to zero but given by I0 = -1/(n-1).), Moran‘s I values can be transformed to z-scores in which values greater than 1.96 or smaller than -1.96 indicate spatial autocorrelation that is significant at the 5% level.
栅格数据的权重规则:In its simplest form, these weights will take values 1 for close neighbours, and 0 otherwise,并规定栅格邻接为四至,如Fig. 1,中间绿色的像元的四至是四个橘红像元,绿色像元与他们之间存在着公共边,四个蓝色像元虽与绿色像元临近但不存在公共边,故而,绿色像元与橘红像元的权重是1,而与蓝色像元权重是0。(Rooks Case, Bishops Case, Oueen‘s (Kings) Case)
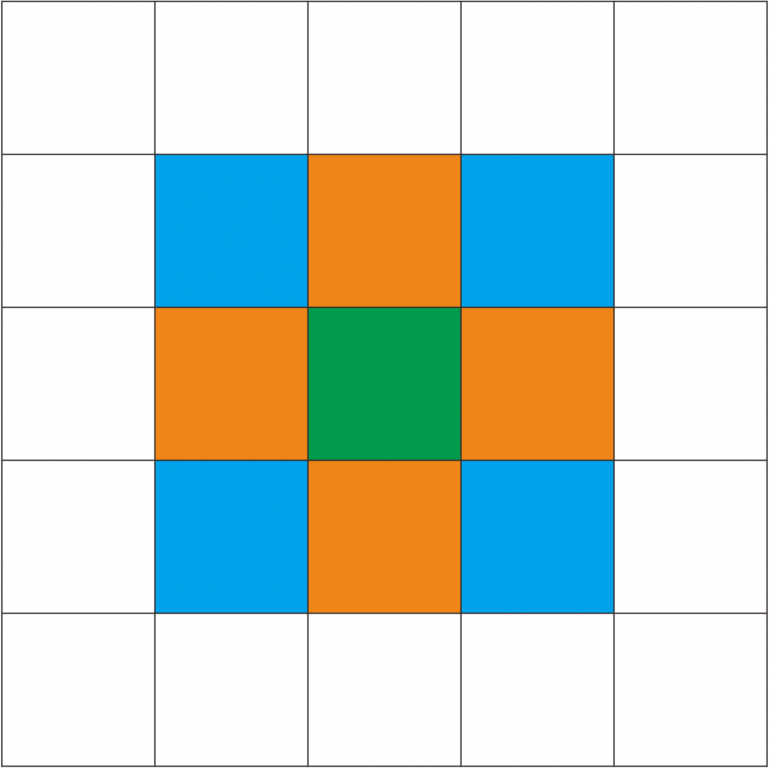
Fig. 1
Example
四张NDVI影像测试本帖代码,计算有效区域(mask影像数值是1像元)的Global Moran‘s I。代码运算结果如Fig. 2,MODIS_NDVI_200308的Global Moran‘s I是0.95467222,Z-score是418.50598145,ArcGIS计算结果分别是0.954661和418.498382,两者计算结果非常接近,考虑到二者计算中间数值的精度不同,这很可能就是引起二者差异的主要原因。其他三张数据情况类似,代码计算结果与ArcGIS结果非常接近。
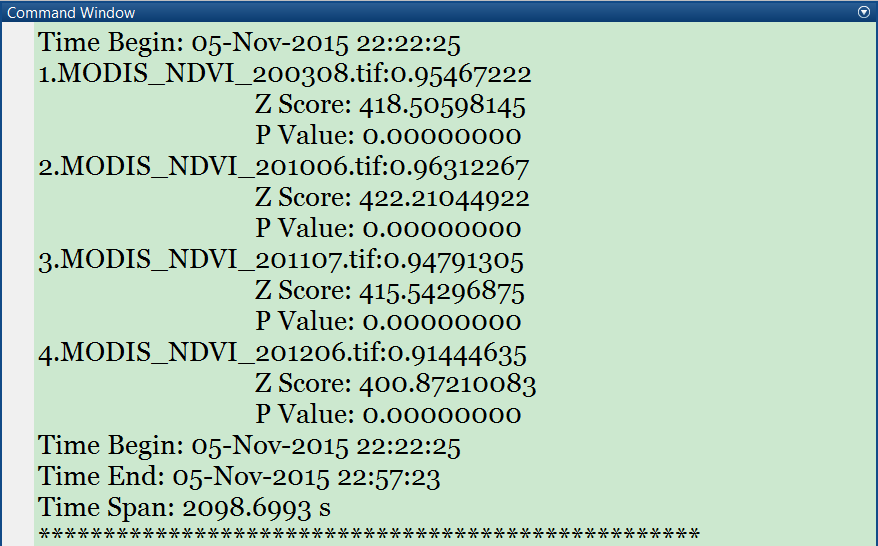
Fig. 2
仍以MODIS_NDVI_200308Z-score为例说明显著性水平。如Fig.3,非常形象地说明Z-score与p之间对应关系,Z-score等于418.50598145大于2.58,说明此时p小于0.01,该Global Moran‘s I等于0.95467222通过0.01显著性水平检验。
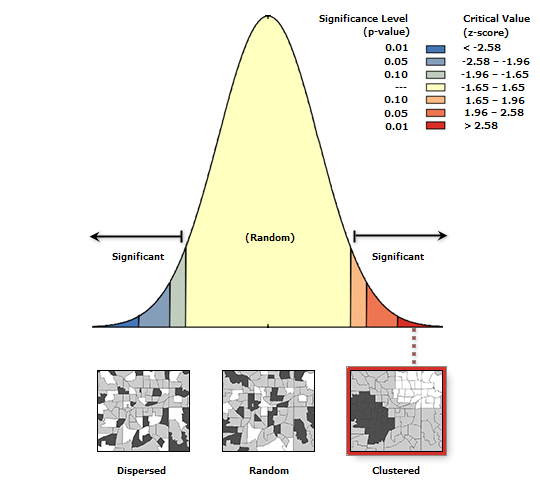
Fig. 3
References
[1] Moran‘s I, from Wikipedia, the free encyclopedia.
[2] Geary‘s C, from Wikipedia, the free encyclopedia.
[3] How Spatial Autocorrelation (Global Moran‘s I) works.
[4] What is spatial autocorrelation (spatial dependency)?
[5] Spatial Autocorrelation, ArcGIS for Polygons.
[6] What is a z-score? What is a p-value?
标签:
原文地址:http://www.cnblogs.com/arxive/p/5087179.html