标签:
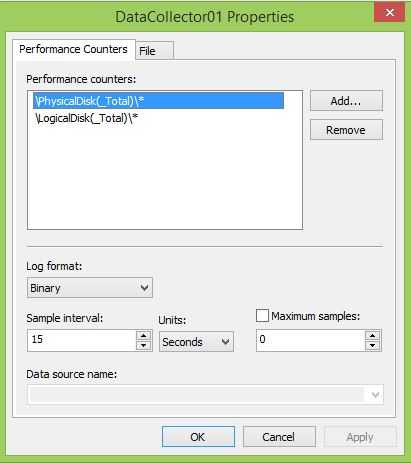
Disk performance Counter 分为两部分:PhysicalDisk and LogicalDisk。
The PhysicalDisk object is used for the analysis of the overall disk, despite the partitions that may be on the disk. When evaluating overall disk performance this would be the one to select.
The LogicalDisk object analyzes information for a single partition. Thus the values will be isolated to activity that is particularly occurring on a single partition and not necessarily representative of the entire load that the disk is burdened with. The LogicalDisk object is useful primarily when looking at the affects or a particular application, like SQL Server, on the disk performance.
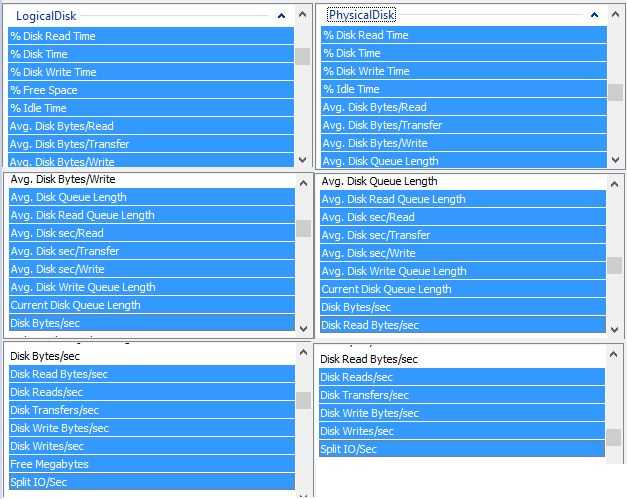
在LogicalDisk和PhysicalDisk Catalog下,有很多子项,如下图
LogicalDisk 比PhysicalDisk多了两个:%Free Sapce 和 Free Megabytes,空闲空间所占的百分比和Size(单位是MB)
Disk Performance 主要分为以下几类
1,Disk Queue (a primary measure of disk congestion)
2,Disk Read / Write
3,Disk transfer
4,Split IO
重要的Disk Performance Counter 有
|
% Disk Time |
计数器监视磁盘忙于读/写活动所用时间的百分比. |
|
Avg.Disk Queue Length |
指读取和写入请求(为所选磁盘在实例间隔中列队的)的平均数 |
|
Current Disk Queue Length |
指示被挂起的磁盘 I/O 请求的数量。如果这个值始终高于 2, 就表示产生了拥塞 |
|
Avg.Disk Bytes/Transfer |
写入或读取操作时向磁盘传送或从磁盘传出字节的平均数 |
|
Disk Bytes/sec |
在读写操作中,从磁盘传出或传送到磁盘的字节速率 |
在系统监视器中,PhysicalDisk: % Disk Time 计数器监视磁盘忙于读/写活动所用时间的百分比。 如果 PhysicalDisk: % Disk Time 计数器的值较高(大于 90%),请检查 PhysicalDisk: Current Disk Queue Length 计数器了解等待进行磁盘访问的系统请求数量。等待 I/O 请求的数量应该保持在不超过组成物理磁盘的轴数的 1.5 到 2 倍。可以使用 Current Disk Queue Length 和 % Disk Time 计数器的值检测磁盘子系统中的瓶颈。
如果 Current Disk Queue Length 和 % Disk Time 计数器的值一直很高,则考虑下列事项:
1.使用速度更快的磁盘驱动器。
2.将某些文件移至其他磁盘或服务器。
3.如果正在使用一个 RAID 阵列,则在该阵列中添加磁盘。(大多数磁盘只有一个轴,但独立磁盘冗余阵列(RAID) 设备通常有多个轴。硬件 RAID 设备在系统监视器中显示为一个物理磁盘。通过软件创建的多个 RAID 设备在系统监视器中显示为多个实例。)
引用:Performance Monitor Counters
Disk Performance Counters
The Disk Performance counters help you to evaluate the performance of the disk subsystem. The disk subsystem is more than the disk itself. It will include to disk controller card, the I/O bus of the system, and the disk. When measuring disk performance it is usually better to have a good baseline for performance than simply to try and evaluate the disk performance on a case by case basis.
There are two objects for the disk—PhysicalDisk and LogicalDisk. The counters for the two are identical. However, in some cases they may lead to slightly different conclusions. The PhysicalDisk object is used for the analysis of the overall disk, despite the partitions that may be on the disk. When evaluating overall disk performance this would be the one to select. The LogicalDisk object analyzes information for a single partition. Thus the values will be isolated to activity that is particularly occurring on a single partition and not necessarily representative of the entire load that the disk is burdened with. The LogicalDisk object is useful primarily when looking at the affects or a particular application, like SQL Server, on the disk performance. Again the PhysicalDisk is primarily for looking at the performance of the entire disk subsystem. In the list that follows, the favored object is indicated with the counter. When the LogicalDisk and PhysicalDisk objects are especially different, the counter will be listed twice and the difference specifically mentioned.
PhysicalDisk : Current Disk Queue Length. This counter provides a primary measure of disk congestion. Just as the processor queue was an indication of waiting threads, the disk queue is an indication of the number of transactions that are waiting to be processed. Recall that the queue is an important measure for services that operate on a transaction basis. Just like the line at the supermarket, the queue will be representative of not only the number of transactions, but also the length and frequency of each transaction.
PhysicalDisk : % Disk Time. Much like % Processor time, this counter is a general mark of how busy the disk is. You will see many similarities between the disk and processor since they are both transaction-based services. This counter indicates a disk problem, but must be observed in conjunction with the Current Disk Queue Length counter to be truly informative. Recall also that the disk could be a bottleneck prior to the % Disk Time reaching 100%.
PhysicalDisk : Avg. Disk Queue Length. This counter is actually strongly related to the %Disk Time counter. This counter converts the %Disk Time to a decimal value and displays it. This counter will be needed in times when the disk configuration employs multiple controllers for multiple physical disks. In these cases, the overall performance of the disk I/O system, which consists of two controllers, could exceed that of an individual disk. Thus, if you were looking at the %Disk Time counter, you would only see a value of 100%, which wouldn‘t represent the total potential of the entire system, but only that it had reached the potential of a single disk on a single controller. The real value may be 120% which the Avg. Disk Queue Length counter would display as 1.2.
PhysicalDisk : Disk Reads/sec. This counter is used to compare to the Memory: Page Inputs/sec counter. You need to compare the two counters to determine how much of the Disk Reads are actually attributed to satisfying page faults.
LogicalDisk : Disk Reads/sec. When observing an individual application (rather a partition) this counter will be an indication of how often the applications on the partition are reading from the disk. This will provide you with a more exact measure of the contribution of the various processes on the partition that are affecting the disk.
PhysicalDisk : Disk Reads Bytes/sec. Primarily, you‘ll use this counter to describe the performance of disk throughput for the disk subsystem. Remember that you are generally measuring the capability of the entire disk hardware subsystem to respond to requests for information.
LogicalDisk : Disk Reads Bytes/sec. For the partition, this will be an indication of the rate that data is being transferred. This will be an indication of what type of activity the partition is experiencing. A smaller value will indicate more random reads of smaller sections.
PhysicalDisk : Avg. Disk Bytes/Read. This counter is used primarily to let you know the average number of bytes transferred per read of the disk system. This helps distinguish between random reads of the disk and the more efficient sequential file reads. A smaller value generally indicates random reads. The value for this counter can also be an indicator of file fragmentation.
PhysicalDisk : Avg. Disk sec/Read. The value for this counter is generally the number of seconds it takes to do each read. On less-complex disk subsystems involving controllers that do not have intelligent management of the I/O, this value is a multiple of the disk‘s rotation per minute. This does not negate the rule that the entire system is being observed. The rotational speed of the hard drive will be the predominant factor in the value with the delays imposed by the controller card and support bus system.
PhysicalDisk: Disk Reads/sec. The value for this counter is the number of reads that the disk was able to accomplish per second. Changes in this value indicate the amount of random access to the disk. The disk is a mechanical device that is capable of only so much activity. When files are closer together, the disk is permitted to get to the files quicker than if the files are spread throughout the disk. In addition, disk fragmentation can contribute to an increased value here.
引用 Windows Performance Monitor 学习笔记
下表对重要的性能计数器做一个简要的说明:
| 性能计数器: | ||
| Performance Object | Counter | Description |
| Processor | %processor Time | 指处理器执行非闲置线程时间的百分比,测量处理器繁忙的时间 这个计数器设计成用来作为处理器活动的主要指示器,可以选择单个CPU实例,也可以选择Total |
| Interrupts/sec | 处理器正在处理的来自应用程序或硬件的中断的数量 | |
| PhysicalDisk | % Disk Time |
计数器监视磁盘忙于读/写活动所用时间的百分比.在系统监视器中,PhysicalDisk: % Disk Time 计数器监视磁盘忙于读/写活动所用时间的百分比。如果 PhysicalDisk: % Disk Time 计数器的值较高(大于 90%),请检查 PhysicalDisk: Current Disk Queue Length 计数器了解等待进行磁盘访问的系统请求数量。等待 I/O 请求的数量应该保持在不超过组成物理磁盘的轴数的 1.5 到 2 倍。大多数磁盘只有一个轴,但独立磁盘冗余阵列 (RAID) 设 备通常有多个轴。硬件 RAID 设备在系统监视器中显示为一个物理磁盘。通过软件创建的多个 RAID 设备在系统监视器中显示为多个实例。
可以使用 Current Disk Queue Length 和 % Disk Time 计数器的值检测磁盘子系统中的瓶颈。如果 Current Disk Queue Length 和 % Disk Time 计数器的值一直很高,则考虑下列事项:
1.使用速度更快的磁盘驱动器。
2.将某些文件移至其他磁盘或服务器。
3.如果正在使用一个 RAID 阵列,则在该阵列中添加磁盘。
|
| Avg.Disk Queue Length | 指读取和写入请求(为所选磁盘在实例间隔中列队的)的平均数 | |
| Current Disk Queue Length | 指示被挂起的磁盘 I/O 请求的数量。如果这个值始终高于 2, 就表示产生了拥塞 | |
| Avg.Disk Bytes/Transfer | 写入或读取操作时向磁盘传送或从磁盘传出字节的平均数 | |
| Disk Bytes/sec | 在读写操作中,从磁盘传出或传送到磁盘的字节速率 | |
| Memory | Pages/sec | 被请求页面的数量. |
| Available Bytes | 可用物理内存的数量 | |
| Committed Bytes | 已分配给物理 RAM 用于存储或分配给页面文件的虚拟内存 | |
| Pool Nonpaged Bytes | 未分页池系统内存区域中的 RAM 数量 | |
| Page Faults/sec | 是每秒钟出错页面的平均数量 | |
| Network Interface | Bytes Received/sec | 使用本网络适配器接收的字节数 |
| Bytes Sent/sec | 使用本网络适配器发送的字节数 | |
| Bytes Total/sec | 使用本网络适配器发送和接收的字节数 | |
| Server | Bytes Received/sec | 把此计数器与网络适配器的总带宽相比较,确定网络连接是否产生瓶颈 |
| SQL Server Access Methods | Page Splits/sec | 每秒由于索引页溢出而发生的页拆分数.如果发现页分裂的次数很多,考虑提高Index的填充因子.数据页将会有更多的空间保留用于做数据的填充,从而减少页拆分 |
| Pages Allocated/sec | 在此 SQL Server 实例的所有数据库中每秒分配的页数。这些页包括从混合区和统一区中分配的页 | |
| Full Scans/sec | 每秒不受限制的完全扫描数. 这些扫描可以是基表扫描,也可以是全文索引扫描 | |
| SQL Server: SQL Statistics | Batch Requests/Sec | 每秒收到的 Transact-SQL 命令批数。这一统计信息受所有约束(如 I/O、用户数、高速缓存大小、请求的复杂程度等)影响。 批处理请求数值高意味着吞吐量 |
| SQL Compilations/Sec | 每秒的编译数。表示编译代码路径被进入的次数。包括 SQL Server 中语句级重新编译导致的编译。当 SQL Server 用户活动稳定后, 该值将达到稳定状态 | |
| Re-Compilations/Sec | 每秒语句重新编译的次数。计算语句重新编译被触发的次数。一般来说,这个数最好较小,存储过程在理想情况下应该只编译一次, 然后执行计划被重复使用. 如果该计数器的值较高,或许需要换个方式编写存储过程,从而减少重编译的次数 | |
| SQL Server: Databases | Log Flushes/sec | 每秒日志刷新数目 |
| Active Transactions | 数据库的活动事务数 | |
| Backup/Restore Throughput/sec | 每秒数据库的备份和还原操作的读取/写入吞吐量。例如,并行使用多个备份设备或使用更快的设备时,可以测量数据库备份操作性能的变化情况。 数据库的备份或还原操作的吞吐量可以确定备份和还原操作的进程和性能 | |
| SQL Server General Statistics | User Connections | 系统中活动的SQL连接数. 该计数器的信息可以用于找出系统的最大并发用户数 |
| Temp Tables Creation Rate | 每秒创建的临时表/表变量的数目 | |
| Temp Tables For Destruction | 等待被清除系统线程破坏的临时表/表变量数 | |
| SQL Server Locks | Number of Deadlocks/sec | 指每秒导致死锁的锁请求数. 死锁对于应用程序的可伸缩性非常有害, 并且会导致恶劣的用户体验. 该计数器必须为0 |
| Average Wait Time (ms) | 每个导致等待的锁请求的平均等待时间 | |
| Lock requests/sec | 锁管理器每秒请求的新锁和锁转换数. 通过优化查询来减少读取次数, 可以减少该计数器的值 | |
| SQL Server:Memory Manager | Total Server Memory (KB) | 从缓冲池提交的内存(这不是 SQL Server 使用的总内存) |
| Target Server Memory (KB) | 服务器能够使用的动态内存总量 | |
| SQL Cache Memory(KB) | 服务器正在用于动态 SQL 高速缓存的动态内存总数 | |
| Memory Grants Pending | 指每秒等待工作空间内存授权的进程数. 该计数器应该尽可能接近0,否则预示可能存在着内存瓶颈 | |
| SQL Server Buffer Manager | Buffer Cache Hit Ratio | 缓存命中率,在缓冲区高速缓存中找到而不需要从磁盘中读取(物理I/O)的页的百分比. 如果该值较低则可能存在内存不足或不正确的索引 |
| Page Reads/sec | 每秒发出的物理数据库页读取数。此统计信息显示的是所有数据库间的物理页读取总数。由于物理 I/O 的开销大,可以通过使用更大的数据缓存、智能索引、更有效的查询或更改数据库设计等方法,将开销降到最低 | |
| Page Writes/sec | 每秒执行的物理数据库页写入数 | |
| Page Life Expectancy | 页若不被引用将在缓冲池中停留的秒数 | |
| Lazy Writes/Sec | 每秒被缓冲区管理器的惰性编写器写入的缓冲区数 | |
| Checkpoint Pages/Sec | 由要求刷新所有脏页的检查点或其他操作每秒刷新到磁盘的页数 |
Performance Counter Usage1:HardDisk Performance
标签:
原文地址:http://www.cnblogs.com/ljhdo/p/5151284.html