标签:
Performance Monitor provides a visual display of built-in Windows performance counters, either in real time or as a way to review historical data. You can add performance counters to Performance Monitor by dragging and dropping, or by creating custom Data Collector Sets. It features multiple graph views to enable you to visually review performance log data, as well as custom views that can be exported as Data Collector Sets for use with performance and logging features.
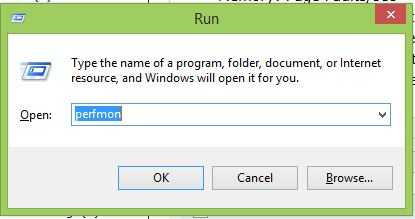
1,Open Performance Monitor
点击 "Windows+R",并按Enter,打开Performance Monitor
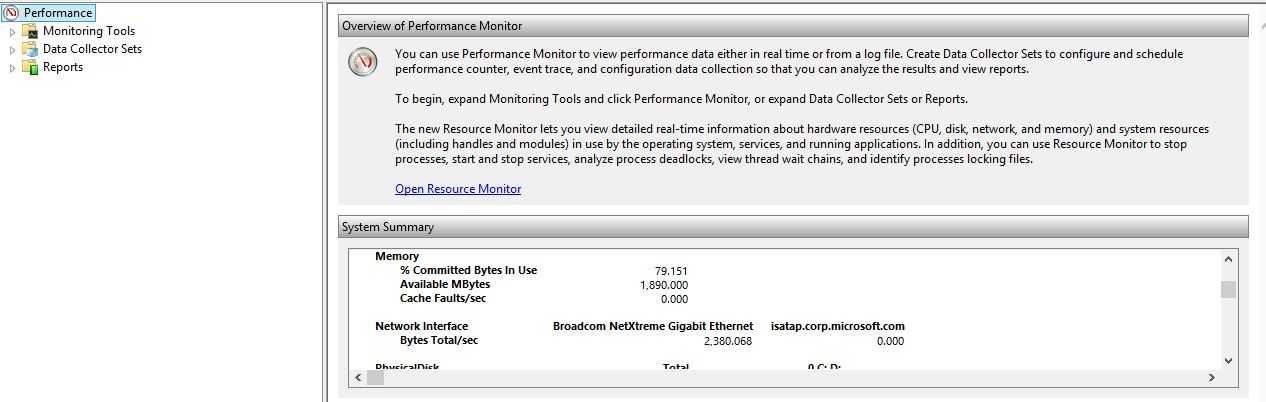
分为两个Pane,right Pane 有System Summary,主要show的是系统的Memory,CPU,Disk,Network 的性能的实时监控数据。
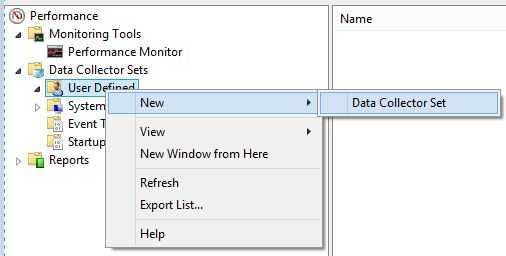
2,Create Data Collector Set
在Data Collector Sets 下,选择 User Defined->New->Data Collector Set
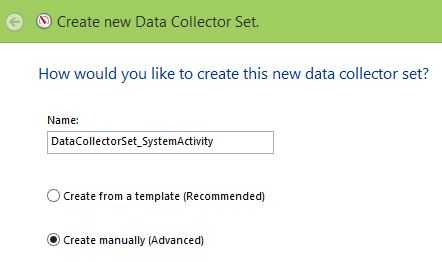
2.1 Create manually
给Data Collector Set 重命名为 DataCollectorSet_SystemActivity,并选择Create manually(Advanced),点击Next
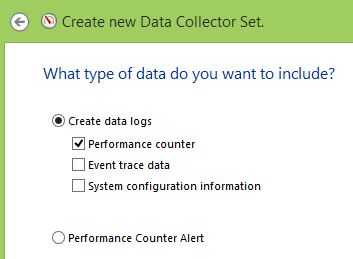
2.2 Create data logs
Create Data logs,选择Performance counter,点击Next
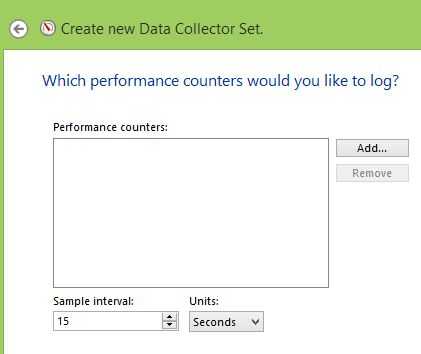
2.3,Add Counters
点击Add,添加 Performance Counters
Sample Interval 使用系统预设的 default value 和 units。
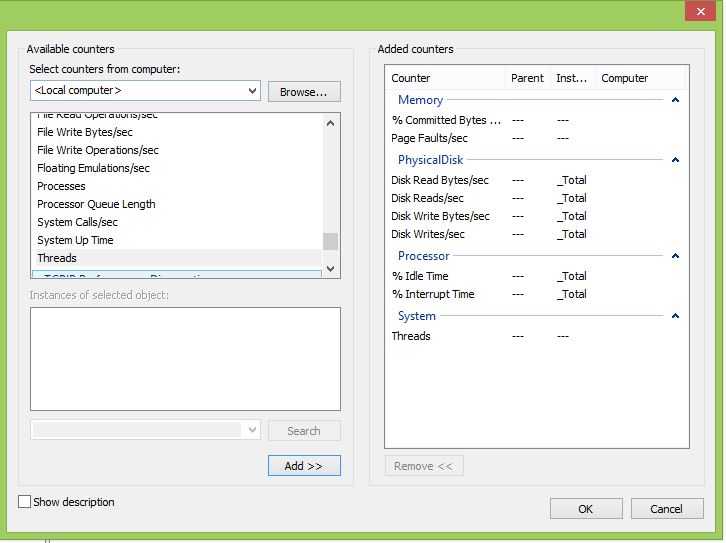
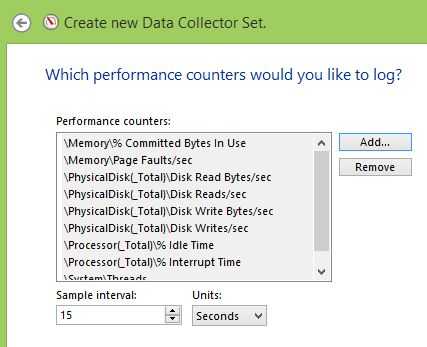
点击Add 添加如下Performance Counters
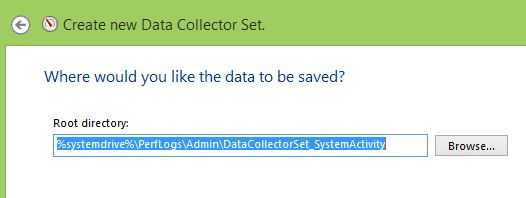
2.4 Save Location
设置Root Dirctory
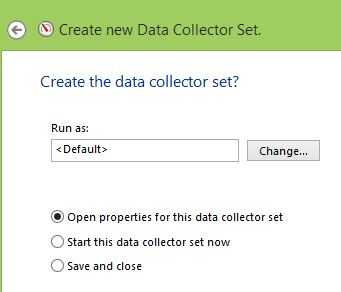
2.5 设置 Run as
Run as 使用默认值,选择open properties for this data collector set,点击 Finish
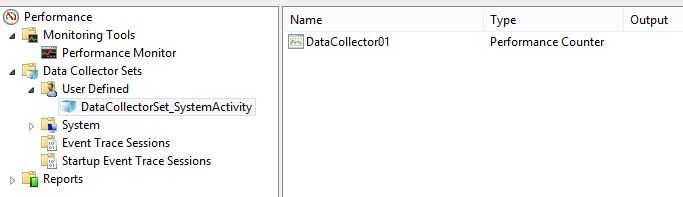
2.6 Data Collector
Data Collector Set 创建完成之后,会在User Defined Catalog 下,显示新建的Data Collector Set。
在right pane中,我们看到一个DataCollector01,Type是Performance Counter,由于我们在 step 2.2 Create data logs 只选择Performance Counter,所以Data Collecotr Set 中只有一个Data Collecotr,并且类型是Performance Counter。
3, data collector set properties
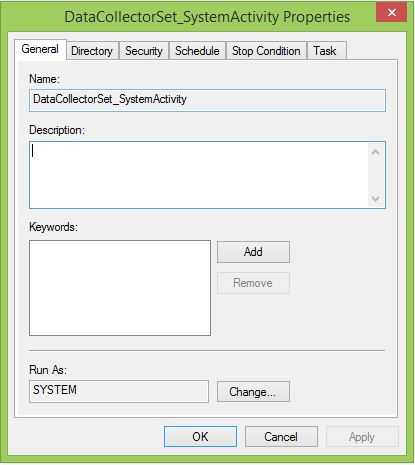
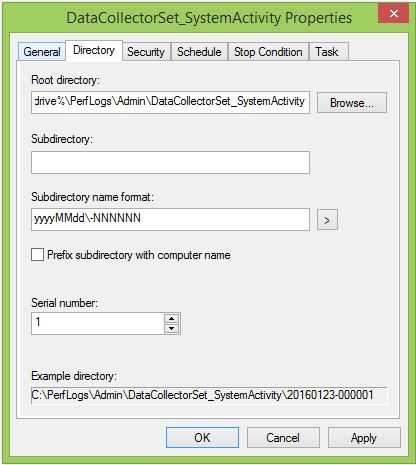
3.1 Directory Tab
设置DataCollector的存放路径和命名规则
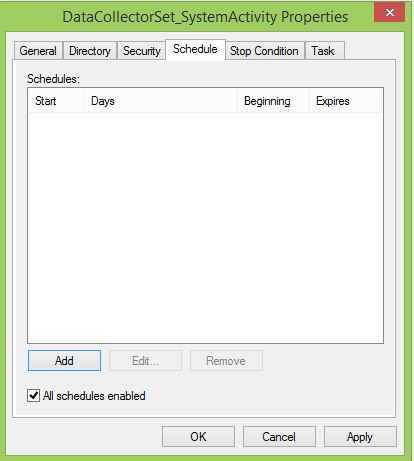
4, Schedule Data Logging
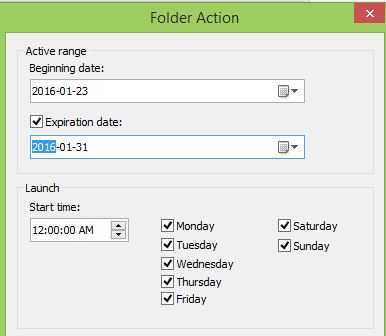
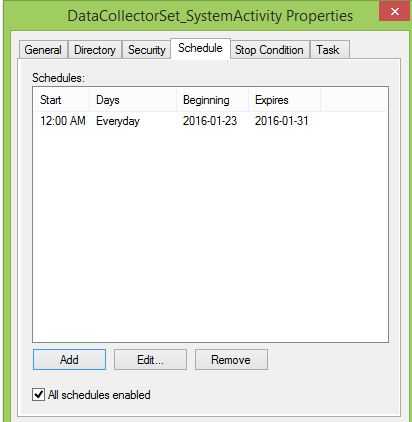
在Schedule Tab中设置Schedule 的时间,点击Add 设置 schedule plan
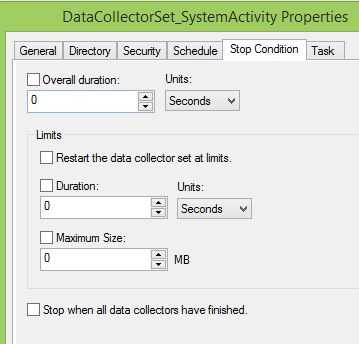
5,set stop condition
Stop condition分为两部分:Overall Duration 和Limits,Overall Duration的优先级更高。
Note:If an overall duration is configured, it will override limits.
If you have configured an overall duration, you can select Stop when all data collectors have finished to let all data collectors finish recording the most recent values before the Data Collector Set is stopped.
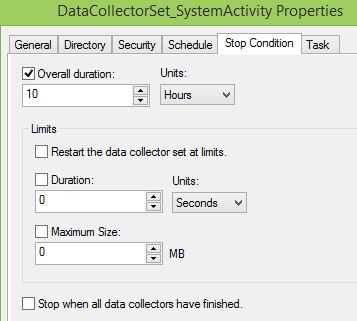
5.1 Overall duariton
Overall duariton是指Data Collector 持续运行的overall 时间。如果设置 10 hours,那么Data Collector 将在运行10Hours之后,停止运行。
5.2 Segment Log files
如果Data Log file 过大,超过300MB,那么在Performance monitor中打开时会非常耗时,所以,可以使用limits 选项将 data collection 分割到单独的小的log files中。当一个Data log file 达到 limit 时,新创建一个data log file 收集数据,这样会得到一系列的小log files,在使用Performance Monitor 查看log 时,会非常流畅。
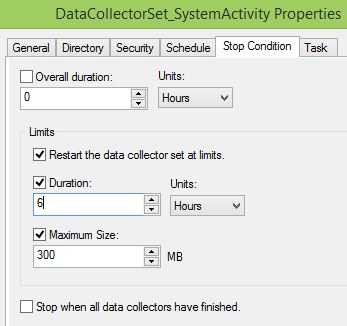
Restart the data collector set at limits: Use limits to segment data collection into separate logs by selecting When a limit is reached, restart the data collector set .
If both limit types are selected, data collection will stop or restart when the first limit is reached.
Remarks:Larger log files result in longer report generation times. If you review your logs frequently to see recent data, we recommend that you use limits to automatically segment your logs. You can use the relog command to segment long log files or combine multiple short log files. For more information about the relog command, type relog /? and press ENTER at a command prompt.
6,Data Management
对Data Collector Set 收集到的Log file 进行自动管理,delete 或者 archieve,避免Disk Space exhausted。
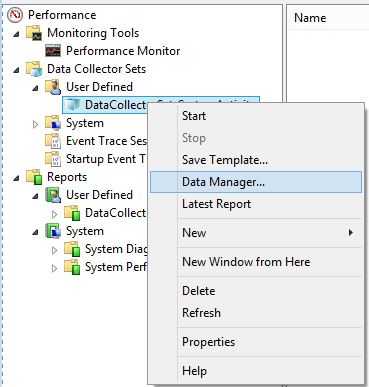
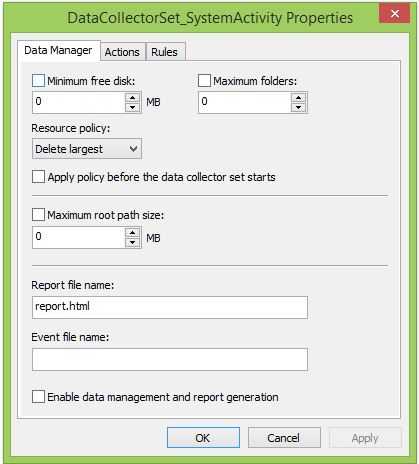
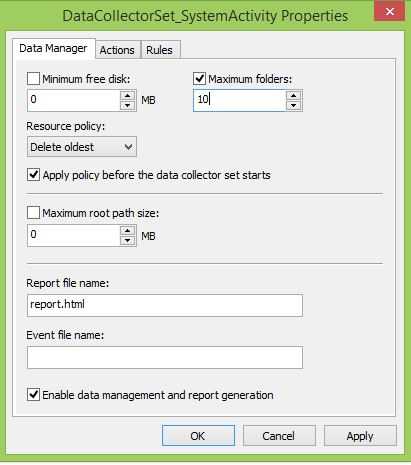
6.1 Data Manager Tab
Resource policy 是 自动删除log files的 policy,有两种policy:删除文件size最大的和删除文件创建日期最早的。
| Option | Definition |
|---|---|
|
Minimum free disk |
The amount of disk space that must be available on the drive where log data is stored. If selected, previous data will be deleted according to the Resource policy that you choose when the limit is reached. |
|
Maximum folders |
The number of subfolders that can be in the Data Collector Set data directory. If selected, previous data will be deleted according to the Resource policy that you choose when the limit is reached. |
|
Resource policy |
Specifies whether to delete the oldest or largest log file or directory when limits are reached. |
|
Maximum root path size |
The maximum size of the data directory for the Data Collector Set, including all subfolders. If selected, this maximum path size overrides the Minimum free disk and Maximum folders limits, and previous data will be deleted according to the Resource policy that you choose when the limit is reached. |
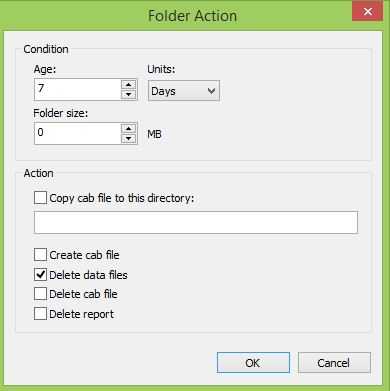
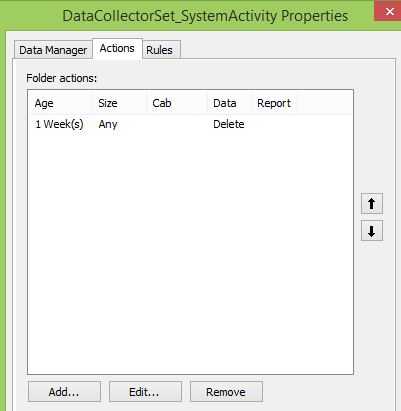
6.2 Actions Tab
Action Tab 主要用于 Data Archive,在永久删除log files 之前,可以log file 转存到其他disk中,归档历史数据。
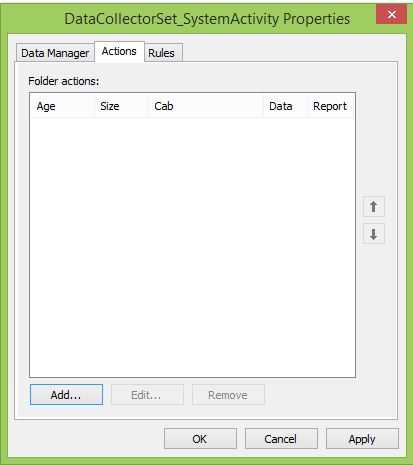
Folder actions allow you to choose how data is archived before it is permanently deleted. You may decide to disable the Data Manager limits in favor of managing all data according to these folder action rules.
| Option | Definition |
|---|---|
|
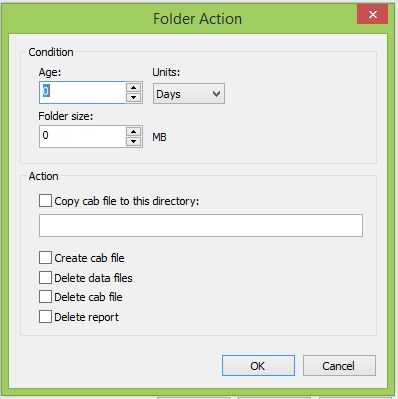
Age |
The age in days or weeks of the data file. If the value is 0, the criterion is not used. |
|
Size |
The size in megabytes (MB) of the folder where log data is stored. If the value is 0, the criterion is not used. |
|
Cab |
A cabinet (.cab) file, which is an archive file format. These files can be created from raw log data and extracted later when needed. Choose create or delete to take action based on the age or size criteria. |
|
Data |
Raw log data collected by the Data Collector Set. Log data can be deleted after a .cab file is created to save disk space while still retaining a backup of the original data. |
|
Report |
The report file generated by Windows Reliability and Performance Monitor from raw log data. Report files can be retained even after the raw data or .cab file has been deleted. |
选择保存7days,将超过7days的file 删除。
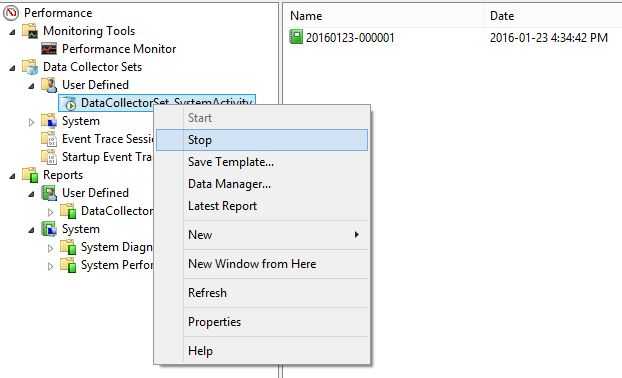
7,start data collector set
在 User Defined catalog下,选中Data Collector set->start,就能开始data collection,在 right pane中,能看到log file的name 和 create date。
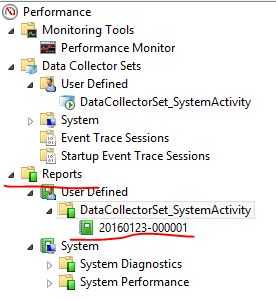
8,Report
在 Reports catalog下,User Defined->DataCollectorSet_Name,能够看到Log files的name,
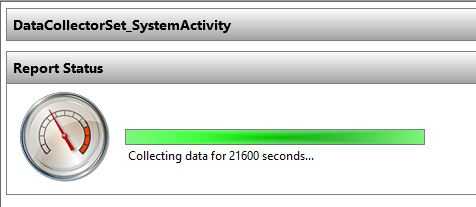
8.1 Data collector set 正在running
点击log file,由于Data collector set正在收集数据,Data collector set会显示 Report Status “Collecting data for xxx seconds”,表示收集数据的status和已经持续的时间。
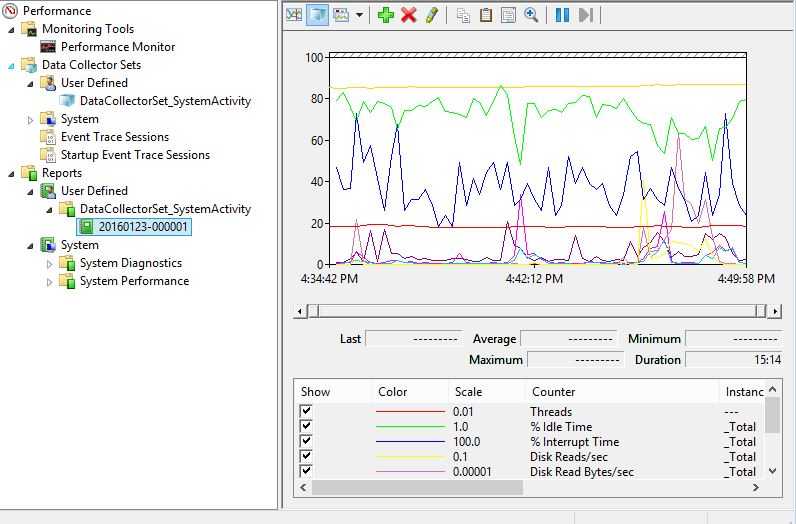
8.2 Data collector set 停止数据收集之后
点击log file,查看Data Collector Set 收集到的Performance Log。
https://technet.microsoft.com/en-us/library/cc771692.aspx
Performance Monitor Usage8:An Practice
标签:
原文地址:http://www.cnblogs.com/ljhdo/p/5153603.html