标签:
To see data in the SQL Server Utility dashboard, select the top node in the Utility Explorer tree - labeled "Utility<UCP_Name>\(ComputerName\UCP)." The dashboard includes summary and detail data from all managed instances of SQL Server and all data-tier applications in the SQL Server Utility. To refresh data in the dashboard, right-click the top node in the Utility Explorer tree, and select Refresh.
Dashboard Report 如下图
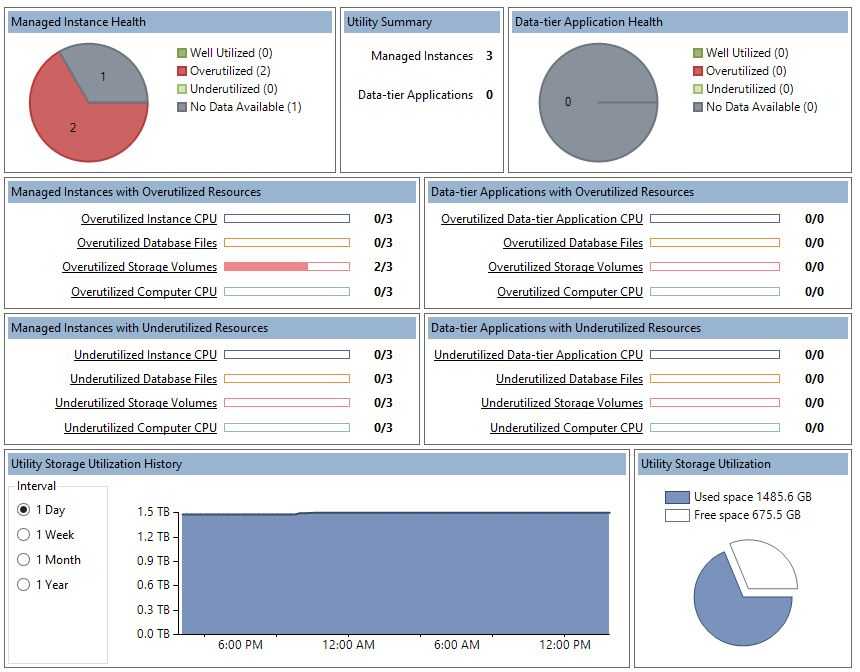
1,health status
2,Utility Storage Utilization
Utility Storage 是UCP的所有数据有效的Managed instancde(health status不是No Data Available的Managed instancde)的Storage 加和之后的utilization.
Utility Storage Utilization History
Utilization history is shown in a time graph at the bottom of the SQL Server Utility dashboard. Note that time data show the UCP local date and time using the datetime data type. When using the Utility object model, note that SSMS uses the datetimeoffset data type.
Use the radio buttons to the left of the display area to change the reporting period for the graph.
Options for the reporting interval are:
After you make a change to the reporting interval, the data refreshes automatically.
Utility Storage Utilization
In the bottom right of the dashboard, the storage utilization pie chart displays the ratio of used space to free space on volumes residing on computers that contain managed instances of SQL Server. Data for this display are refreshed every 15 minutes.
3,understand concept
参考文档;
Utility Dashboard (SQL Server Utility)
Utility3:Understand Dashboard Report
标签:
原文地址:http://www.cnblogs.com/ljhdo/p/5180195.html