标签:
小萝卜:师兄!过年啦!是不是很无聊啊!普通人的生活就是赚钱花钱,实在是很没意思啊!
师兄:是啊……
小萝卜:他们都不懂搞科研和码代码的乐趣呀!
师兄:可不是嘛……
小萝卜:所以今年过年,我们再做一个SLAM吧!之前写的那个太烂了啦,我都不好意思说是我做的了!
师兄:嗯那可真是对不住你啊……
小萝卜:没事!你再写一个好一点的,我就原谅你了!写完再请我吃饭吧!
师兄:啊,好的……
小萝卜:师兄你别这么没精神啊!加油咯!
在经过了一番激烈的思想斗争之后呢,师兄厌倦了年假的无聊生活,开始写《一起做RGBD SLAM》的第二季!在这一系列中,我们会讨论RGBD SLAM程序中一些更深入的话题,从而编写一个更快、更好用的程序。改进的地方大致如下:
这么一看,其实整体上问题还是挺多的。在第二季中,我们将致力于解决这些问题,同时我们的程序也会变得相对比较复杂。鉴于很多基础的问题我们在第一季中已经提过,本次我就不讲怎么安装OpenCV之类的事情啦。但是,为了保证大家能理解博客内容,我们和以往一样,给出实现过程中的所有代码和数据。
代码请参见:https://github.com/gaoxiang12/rgbd-slam-tutor2
TUM数据集网址:http://vision.in.tum.de/data/datasets/rgbd-dataset
本系列使用TUM中的一个数据:fr1_room。读者可以去TUM网站找,或者直接从我的百度云里下载: http://pan.baidu.com/s/1c1fviSS
TUM数据集的使用方法我们将在后文介绍。
第二季中,我们仍使用C++和Cmake作为编程语言和框架。我使用的电脑是 Ubuntu 14.04 系统。读者也可以自行挑选其他linux操作系统,但是我只给出在ubuntu下安装各种工具的方式。
首先,请从github中下载这个系列用到的代码:
1 git clone https://github.com/gaoxiang12/rgbd-slam-tutor2.git
你会看到几个文件夹。和第一个系列一样,我们把不同的代码归类放置。几个文件夹的内容如下:
第一讲的代码还没有那么全。随着讲解的进行,我们会逐步将代码添加到各个文件夹中去。
我们构建代码的思路是这样的。把与slam相关的代码(include和src下)编译成一个库,把测试用的程序(experiment下)编译成可执行文件,并链接到这个slam库上。举例来说,我们会把orb特征的提取和匹配代码放到库中,然后在experiment里写一个程序,读一些具体的图片并提取orb特征。以后我们也将用这个方式来编写回环检测等模块。
至于为何要放Thirdparty呢?因为像g2o这样的库,版本有时会发生变化。所以我们就把它直接放到代码目录里,而不是让读者自己去找g2o的源码,这样就可以保证我们的代码在读者的电脑上也能顺利编译。但是像 opencv,pcl 这些大型又较稳定的库,我们就交给读者自行编译安装了。
除了Thirdparty下的库,请读者自行安装这样依赖库:
sudo apt-get install libopencv-dev
Thirdparty下的库,多为cmake工程,所以按照通常的cmake编译方式即可安装。它们的依赖基本可以在ubuntu的软件仓库中找到, 我们会在用到时再加以介绍。
本次我们使用tum提供的数据集。tum的数据集带有标准的轨迹和一些比较工具,更适合用来研究。同时,相比于nyud数据集,它也要更加困难一些。使用这个数据集时应当注意它的存储格式(当然使用任何数据集都应当注意)。
下面我们以fr1_room为例来说明TUM数据集的用法。fr1_room的下载方式见上面的百度云或者TUM官网。
下载我们提供的 “rgbd_dataset_freiburg1_room.tgz”至任意目录,解压后像这样:
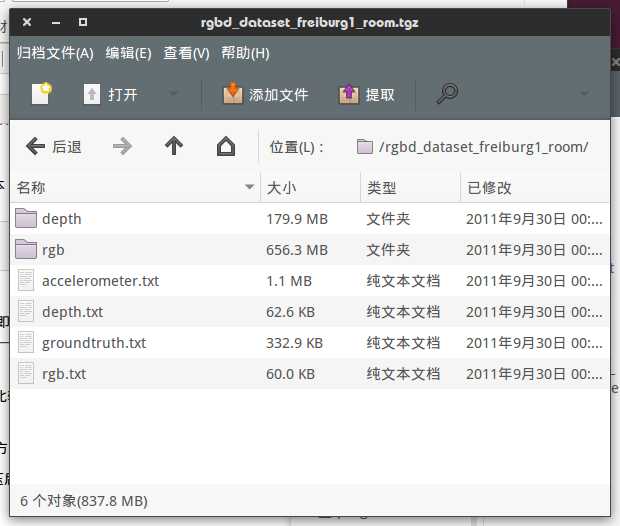 rgb和depth文件夹下存放着彩色图和深度图。图像的文件名是以采集时间命名的。而rgb.txt和depth.txt则存储了所有图像的采集时间和文件名称,例如:
1305031910.765238 rgb/1305031910.765238.png
表示在机器时间1305031910.765238采集了一张RGB图像,存放于rgb/1305031910.765238.png中。
这种存储方式的一个特点是,没有直接的rgb-depth一一对应关系。由于采集时间的差异,几乎没有两张图像是同一个时刻采集的。然而,我们在处理图像时,需要把一个RGB和一个depth当成一对来处理。所以,我们需要一步预处理,找到rgb和depth图像的一一对应关系。
TUM为我们提供了一个工具来做这件事,详细的说明请看:http://vision.in.tum.de/data/datasets/rgbd-dataset/tools 该网页整理了一些常用工具,包括时间配对,ground-truth误差比对、图像到点云的转换等。对于现在预处理这一步,我们需要的是一个 associate.py 文件,如下(你可以直接把内容拷下来,存成本地的associate.py文件):

#!/usr/bin/python
# Software License Agreement (BSD License)
#
# Copyright (c) 2013, Juergen Sturm, TUM
# All rights reserved.
#
# Redistribution and use in source and binary forms, with or without
# modification, are permitted provided that the following conditions
# are met:
#
#  * Redistributions of source code must retain the above copyright
#    notice, this list of conditions and the following disclaimer.
#  * Redistributions in binary form must reproduce the above
#    copyright notice, this list of conditions and the following
#    disclaimer in the documentation and/or other materials provided
#    with the distribution.
#  * Neither the name of TUM nor the names of its
#    contributors may be used to endorse or promote products derived
#    from this software without specific prior written permission.
#
# THIS SOFTWARE IS PROVIDED BY THE COPYRIGHT HOLDERS AND CONTRIBUTORS
# "AS IS" AND ANY EXPRESS OR IMPLIED WARRANTIES, INCLUDING, BUT NOT
# LIMITED TO, THE IMPLIED WARRANTIES OF MERCHANTABILITY AND FITNESS
# FOR A PARTICULAR PURPOSE ARE DISCLAIMED. IN NO EVENT SHALL THE
# COPYRIGHT OWNER OR CONTRIBUTORS BE LIABLE FOR ANY DIRECT, INDIRECT,
# INCIDENTAL, SPECIAL, EXEMPLARY, OR CONSEQUENTIAL DAMAGES (INCLUDING,
# BUT NOT LIMITED TO, PROCUREMENT OF SUBSTITUTE GOODS OR SERVICES;
# LOSS OF USE, DATA, OR PROFITS; OR BUSINESS INTERRUPTION) HOWEVER
# CAUSED AND ON ANY THEORY OF LIABILITY, WHETHER IN CONTRACT, STRICT
# LIABILITY, OR TORT (INCLUDING NEGLIGENCE OR OTHERWISE) ARISING IN
# ANY WAY OUT OF THE USE OF THIS SOFTWARE, EVEN IF ADVISED OF THE
# POSSIBILITY OF SUCH DAMAGE.
#
# Requirements:
# sudo apt-get install python-argparse

"""
The Kinect provides the color and depth images in an un-synchronized way. This means that the set of time stamps from the color images do not intersect with those of the depth images. Therefore, we need some way of associating color images to depth images.

For this purpose, you can use the ‘‘associate.py‘‘ script. It reads the time stamps from the rgb.txt file and the depth.txt file, and joins them by finding the best matches.
"""

import argparse
import sys
import os
import numpy


def read_file_list(filename):
    """
    Reads a trajectory from a text file.

    File format:
    The file format is "stamp d1 d2 d3 ...", where stamp denotes the time stamp (to be matched)
    and "d1 d2 d3.." is arbitary data (e.g., a 3D position and 3D orientation) associated to this timestamp.

    Input:
    filename -- File name

    Output:
    dict -- dictionary of (stamp,data) tuples

    """
    file = open(filename)
    data = file.read()
    lines = data.replace(","," ").replace("\t"," ").split("\n")
    list = [[v.strip() for v in line.split(" ") if v.strip()!=""] for line in lines if len(line)>0 and line[0]!="#"]
    list = [(float(l[0]),l[1:]) for l in list if len(l)>1]
    return dict(list)

def associate(first_list, second_list,offset,max_difference):
    """
    Associate two dictionaries of (stamp,data). As the time stamps never match exactly, we aim
    to find the closest match for every input tuple.

    Input:
    first_list -- first dictionary of (stamp,data) tuples
    second_list -- second dictionary of (stamp,data) tuples
    offset -- time offset between both dictionaries (e.g., to model the delay between the sensors)
    max_difference -- search radius for candidate generation

    Output:
    matches -- list of matched tuples ((stamp1,data1),(stamp2,data2))

    """
    first_keys = first_list.keys()
    second_keys = second_list.keys()
    potential_matches = [(abs(a - (b + offset)), a, b)
                         for a in first_keys
                         for b in second_keys
                         if abs(a - (b + offset)) < max_difference]
    potential_matches.sort()
    matches = []
    for diff, a, b in potential_matches:
        if a in first_keys and b in second_keys:
            first_keys.remove(a)
            second_keys.remove(b)
            matches.append((a, b))

    matches.sort()
    return matches

if __name__ == ‘__main__‘:

    # parse command line
    parser = argparse.ArgumentParser(description=‘‘‘
    This script takes two data files with timestamps and associates them
    ‘‘‘)
    parser.add_argument(‘first_file‘, help=‘first text file (format: timestamp data)‘)
    parser.add_argument(‘second_file‘, help=‘second text file (format: timestamp data)‘)
    parser.add_argument(‘--first_only‘, help=‘only output associated lines from first file‘, action=‘store_true‘)
    parser.add_argument(‘--offset‘, help=‘time offset added to the timestamps of the second file (default: 0.0)‘,default=0.0)
    parser.add_argument(‘--max_difference‘, help=‘maximally allowed time difference for matching entries (default: 0.02)‘,default=0.02)
    args = parser.parse_args()

    first_list = read_file_list(args.first_file)
    second_list = read_file_list(args.second_file)

    matches = associate(first_list, second_list,float(args.offset),float(args.max_difference))

    if args.first_only:
        for a,b in matches:
            print("%f %s"%(a," ".join(first_list[a])))
    else:
        for a,b in matches:
            print("%f %s %f %s"%(a," ".join(first_list[a]),b-float(args.offset)," ".join(second_list[b])))
小萝卜:那么这个文件要怎么用呢?
如果读者熟悉python,就很容易看懂它的用法。实际上,只要给它两个文件名即可,它会输出一个匹配好的序列,像这样:
python associate.py rgb.txt depth.txt
输出则是一行一行的数据,如:
1305031955.536891 rgb/1305031955.536891.png 1305031955.552015 depth/1305031955.552015.png
小萝卜:我知道!这一行就是配对好的RGB图和深度图了,对吧!
师兄:对!程序默认时间差在0.02内的就可以当成一对图像。为了保存这个结果,我们可以把它输出到一个文件中去,如:
python associate.py rgb.txt depth.txt > associate.txt
这样,只要有了这个associate.txt文件,我们就可以找到一对对的RGB和彩色图啦!
小萝卜:配对配对什么的,总觉得像在相亲啊……
ground truth是TUM数据集提供的标准轨迹,它是由一个外部的(很高级的)运动捕捉装置测量的,基本上你可以把它当成一个标准答案喽!ground truth的记录格式也和前面类似,像这样:
1305031907.2496 -0.0730 -0.4169 1.5916 0.8772 -0.1170 0.0666 -0.4608
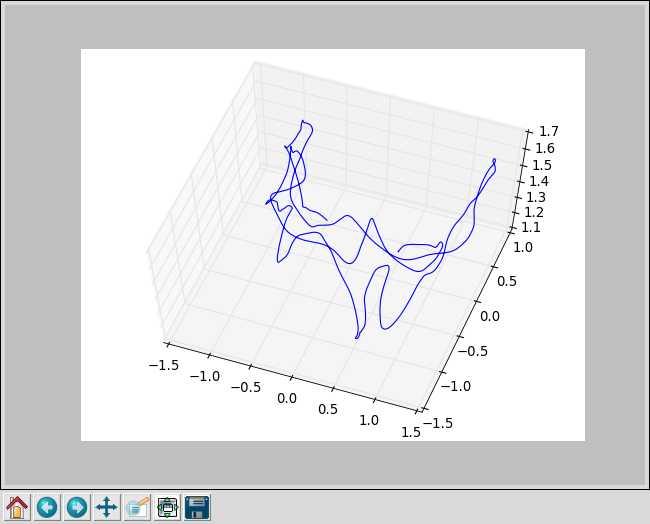
各个数据分别是:时间,位置(x,y,z),姿态四元数(qx, qy, qz, qw),对四元数不熟悉的同学可以看看“数学基础”那几篇博客。那么这个轨迹长什么样呢?我们写个小脚本来画个图看看:
#!/usr/bin/env python
# coding=utf-8

import numpy as np
import matplotlib.pyplot as plt
import mpl_toolkits.mplot3d

f = open("./groundtruth.txt")
x = []
y = []
z = []
for line in f:
    if line[0] == ‘#‘:
        continue
    data = line.split()
    x.append( float(data[1] ) )
    y.append( float(data[2] ) )
    z.append( float(data[3] ) )
ax = plt.subplot( 111, projection=‘3d‘)
ax.plot(x,y,z)
plt.show()
把这部分代码复制存储成draw_groundtruth.py存放到数据目录中,再运行:
python draw_groundtruth.py
就能看到轨迹的形状啦:
第二件事,因为外部那个运动捕捉装置的记录频率比较高,得到的轨迹点也比图像密集很多,如何查找每个图像的真实位置呢?
还记得associate.py不?我们可以用同样的方式来匹配associate.txt和groundtruth.txt中的时间信息哦:
python associate.py associate.txt groundtruth.txt > associate_with_groundtruth.txt
这时,我们的新文件 associate_with_groundtruth.txt 中就含有每个帧的位姿信息了:
1305031910.765238 rgb/1305031910.765238.png 1305031910.771502 depth/1305031910.771502.png 1305031910.769500 -0.8683 0.6026 1.5627 0.8219 -0.3912 0.1615 -0.3811
是不是很方便呢?对于TUM中其他的序列也可以同样处理。
TUM数据集一共用了三个机器人,记成fr1, fr2, fr3。这三台相机的参数在这里: http://vision.in.tum.de/data/datasets/rgbd-dataset/file_formats#intrinsic_camera_calibration_of_the_kinect
数据当中,深度图已经根据内参向RGB作了调整。所以相机内参以RGB为主:
| Camera | fx | fy | cx | cy | d0 | d1 | d2 | d3 | d4 |
| (ROS default) | 525.0 | 525.0 | 319.5 | 239.5 | 0.0 | 0.0 | 0.0 | 0.0 | 0.0 |
| Freiburg 1 RGB | 517.3 | 516.5 | 318.6 | 255.3 | 0.2624 | -0.9531 | -0.0054 | 0.0026 | 1.1633 |
| Freiburg 2 RGB | 520.9 | 521.0 | 325.1 | 249.7 | 0.2312 | -0.7849 | -0.0033 | -0.0001 | 0.9172 |
| Freiburg 3 RGB | 535.4 | 539.2 | 320.1 | 247.6 | 0 | 0 | 0 | 0 | 0 |
深度相机的scale为5000(和kinect默认的1000是不同的)。也就是depth/中图像像素值5000为真实世界中的一米。
因此,你下载了哪个序列,就要用对应的内参哦!
现在让我们来写第一部分代码:读取tum数据集并以视频的方式显示出来。
嗯,在写代码之前呢,师兄还有一些话要啰嗦。虽然我们用linux的同学以会用vim和emacs为傲,但是写代码呢,还是希望有一个IDE可以用的。vim和emacs的编辑确实很方便,然而写c++,你还需要在类定义/声明里跳转,需要补全和提示。要让vim和emacs来做这种事,不是不可以,但是极其麻烦。这次师兄给大家推荐一个可以用于c++和cmake的IDE,叫做qtcreator。
安装qtcreator:
sudo apt-get install qtcreator
界面大概长这样:
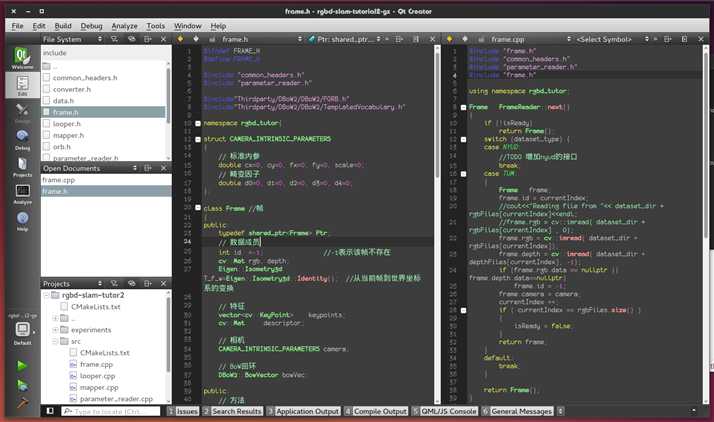
这东西直接的好处是支持cmake。只要是cmake工程就可以丢进去编译。按住ctrl键可以在各个类定义/变量/实现之间快速导航。如果你的cmake设置成了debug模式,它还能进行断点调试,十分的好用!
此外,由于ROS使用的catkin也是cmake的形式,所以它还能用来调试ROS程序!
当然,因为叫qtcreator,自然还能写qt的程序……然而这似乎已经不重要了……具体配置请大家自行摸索啦!
这件事情其实很简单的喽!
首先,随便找一个文件夹,作为你代码的根目录。在此目录下新建一个CMakeLists.txt,输入这些内容:
cmake_minimum_required( VERSION 2.8 )
project( rgbd-slam-tutor2 )

# 设置用debug还是release模式。debug允许断点,而release更快
#set( CMAKE_BUILD_TYPE Debug )
set( CMAKE_BUILD_TYPE Release )

# 设置编译选项
# 允许c++11标准、O3优化、多线程。match选项可避免一些cpu上的问题
set( CMAKE_CXX_FLAGS "${CMAKE_CXX_FLAGS} -std=c++11 -march=native -O3 -pthread" )

# 常见依赖库:cv, eigen, pcl
find_package( OpenCV REQUIRED )
find_package( Eigen3 REQUIRED )
find_package( PCL 1.7 REQUIRED )

include_directories(${PCL_INCLUDE_DIRS})
link_directories(${PCL_LIBRARY_DIRS})
add_definitions(${PCL_DEFINITIONS})

# 二进制文件输出到bin
set( EXECUTABLE_OUTPUT_PATH ${PROJECT_SOURCE_DIR}/bin )
# 库输出到lib
set( CMAKE_LIBRARY_OUTPUT_DIRECTORY ${PROJECT_SOURCE_DIR}/lib )

# 头文件目录
include_directories(
    ${PROJECT_SOURCE_DIR}/include
    )

# 源文件目录
add_subdirectory( ${PROJECT_SOURCE_DIR}/src/ )
add_subdirectory( ${PROJECT_SOURCE_DIR}/experiment/ )
重要部分已经加上注释。
然后,在src/和experiment/下也新建两个CMakeLists.txt,暂不填写内容:
touch src/CMakeLists.txt experiment/CMakeLists.txt
下面,用qtcreator菜单中的File->Open file or project,打开刚才写的CMakeLists.txt,它会识别出这是个cmake工程,并提示你要在何出构建。通常我们是新建一个build文件夹来构建的,所以这次也这么做好了:
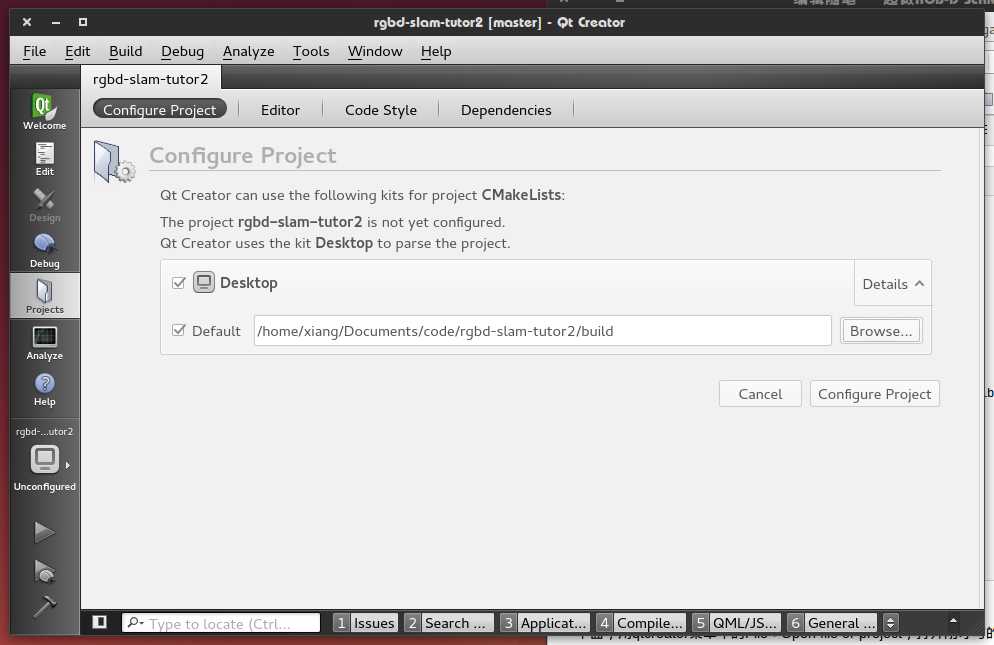
这样就设置好啦。这时,点击左侧的小锤或按下Ctrl+B,就可以构建工程。但是由于现在工程是空的,并没有什么可以构建的。所以我们加一个helloslam试试。在experiment下新建一个helloslam.cpp文件,输入:
1 #include<iostream>
2 using namespace std;
3
4 int main()
5 {
6     cout<<"Hello SLAM!"<<endl;
7     return 0;
8 }
然后,修改experiment/CMakeLists.txt文件,告诉它我们要编译这个文件:
add_executable( helloslam helloslam.cpp )
然后,按下Ctrl+B,完成构建。此时会出现一个小绿条,提示你构建完毕。最后,点击左下绿色的三角按钮,运行此程序:
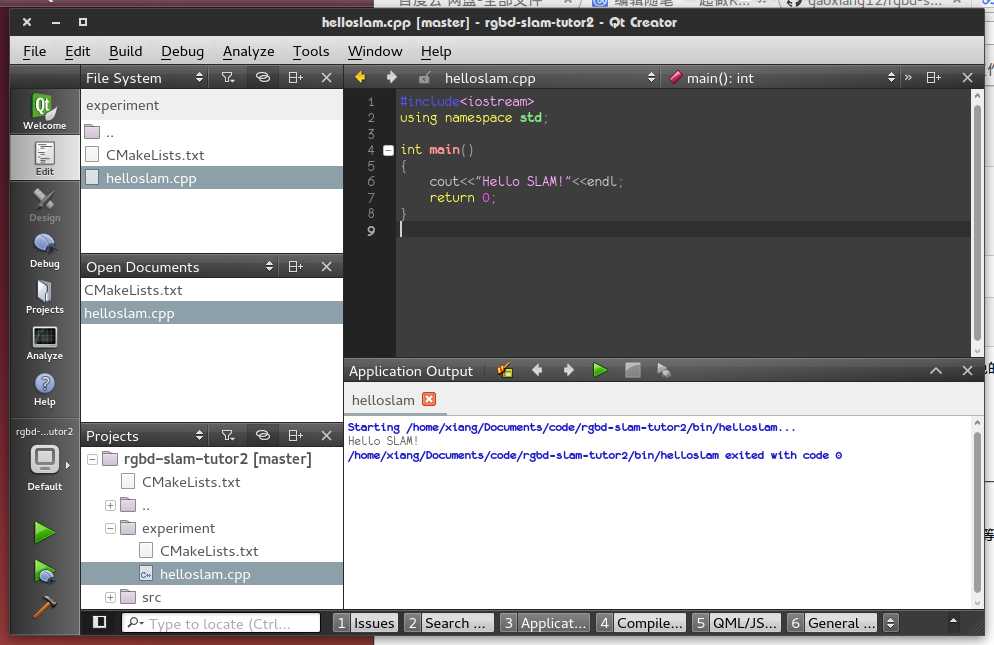
怎么样,是不是很轻松?
读者可以尝试按住Ctrl并点击变量,看看qtcreator是如何跳转的。或者人为加一句错误代码,看它会不会提示错误。也可以输入 cout. 看它会提示哪些东西。甚至可以调成Debug模式,设置断点,看程序是否会停在断点上。
下期我们会讲基本的IO操作,包括参数文件的读取,TUM图像读取与显示,以及程序的测速等等。
1. draw_groundtruth.py 跑不起来?
sudo apt-get install python-matplotlib python-numpy
再试试。
2.为什么我的qtcreator是白的?
黑色只是个配色,在Tools/optoins中进行修改。其实白的也挺好看的。
标签:
原文地址:http://www.cnblogs.com/gaoxiang12/p/5175118.html