标签:
<!DOCTYPE html>
<html lang="en">
<head>
<meta charset="utf-8">
<title>ECharts</title>
</head>
<body>
<!--Step:1 Prepare a dom for ECharts which (must) has size (width & hight)-->
<!--Step:1 为ECharts准备一个具备大小(宽高)的Dom-->
<input type="button" value="测试" onclick="test()" />
<div id="main" style="height:500px;border:1px solid #ccc;padding:10px;"></div>
<!--Step:2 Import echarts-all.js-->
<!--Step:2 引入echarts-all.js-->
<script src="js/echarts-all.js"></script>
<script type="text/javascript">
// Step:3 echarts & zrender as a Global Interface by the echarts-plain.js.
// Step:3 echarts和zrender被echarts-plain.js写入为全局接口
var myChart = echarts.init(document.getElementById(‘main‘));
myChart.setOption({
tooltip : {
trigger: ‘axis‘
},
toolbox: {
show : true,
feature : {
mark : {show: true},
dataView : {show: true, readOnly: false},
magicType : {show: true, type: [‘line‘, ‘bar‘]},
restore : {show: true},
saveAsImage : {show: true}
}
},
xAxis : [
{
type : ‘category‘,
data : [‘1月‘,‘2月‘,‘3月‘,‘4月‘,‘5月‘,‘6月‘,‘7月‘,‘8月‘,‘9月‘,‘10月‘,‘11月‘,‘12月‘]
}
],
yAxis : [
{
type : ‘value‘,
splitArea : {show : true}
}
],
series : [
{
name:‘温度值‘,
type:‘line‘,
data:[2.0, 4.9, 7.0, 23.2, 25.6, 76.7, 135.6, 162.2, 32.6, 20.0, 6.4, 3.3]
}
]
});
var now = +new Date(1997, 9, 3);
var oneMinutes = 60 * 1000*15;
var value = Math.random() * 1000;
function test() {
var dates = [];
var datas = [];
for (var i = 0; i < 24 * 4; i++) {
now = new Date(+now + oneMinutes);
dates.push(now.getHours() + ":" + now.getMinutes());
value = value + Math.random() * 21 - 10;
datas.push(value);
}
myChart.setOption({
xAxis: [
{
type: ‘category‘,
data: dates
}
],
series: [
{
name: ‘蒸发量‘,
type: ‘line‘,
data: datas
}
]
});
}
</script>
</body>
</html>
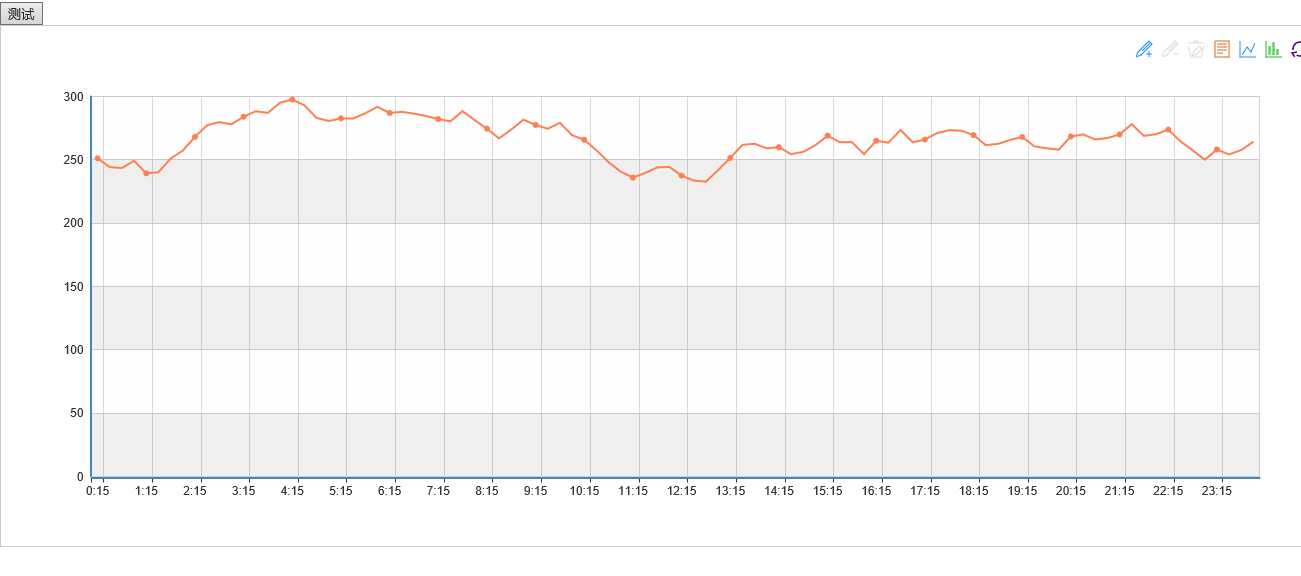
运行截图
标签:
原文地址:http://www.cnblogs.com/wangchaozhi/p/5246008.html