标签:

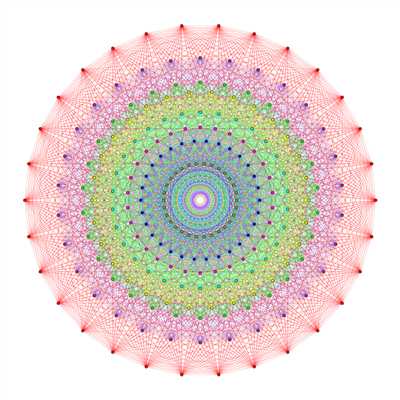
上图是把李代数 $E_8$ 根系投影到其 Coxeter 平面得到的效果图。
$E_8$ 根系顾名思义,包含 8 维空间中的 240 个向量,从形式上看它们分为两大类:
1. $(\pm1,\pm1,0,0,0,0,0,0)$ 的所有置换,即有两个分量是 $+1$ 或者 $-1$,其余6个分量都是 0 的向量。这样的向量有 112 个。
2. 形如 $1/2\times(\pm1,\pm1,\cdots,\pm1)$ 的向量,其中 $-1$ 的个数是偶数。这样的向量有 128 个。
所有向量的长度都是 $\sqrt{2}$,两个向量用一条边相连,当且仅当它们的夹角为 $\pi/3$。每个向量都恰好有 56 条边与之相连。
绘图的过程就是选择 Coxeter 平面的一组单位正交向量 $u,v$,对根系中的每个向量 $x$,计算内积 $(u,x),(v,x)$,这就是投影点,然后把相邻的投影点连线即可。
怎样求 Coxeter 平面呢?这里面的数学比较复杂,我简要叙述如下,证明见 Humphreys 的书 "Reflection groups and Coxeter groups" 第三章的 17 小节。
1. 首先写出一组单根系来,我们知道 $E_8$ 的 Dynkin 图形如
\[\begin{array}{c}1 --- 2 --- & 3 --- 4 --- 5 --- 6 --- 7\\ &| \\ &8 \end{array}\]
这里的第 $i$ 个向量由下面矩阵的第 $i$ 行给出:
\[\begin{bmatrix}1&-1&0&0&0&0&0&0\\0&1&-1&0&0&0&0&0\\0&0&1&-1&0&0&0&0\\0&0&0&1&-1&0&0&0\\0&0&0&0&1&-1&0&0\\0&0&0&0&0&1&1&0\\-\frac{1}{2}&-\frac{1}{2}&-\frac{1}{2}&-\frac{1}{2}&-\frac{1}{2}&-\frac{1}{2}&-\frac{1}{2}&-\frac{1}{2}\\0&0&0&0&0&1&-1&0\end{bmatrix}.\]
2. 将这 8 个单根分成不交的两组,使得每一组内部的单根之间是互相正交的(从而它们对应的单反射两两可以交换)。用 Dynkin 图的标号表示的话,分别是 $I=\{1,3,5,7\}$ 和 $J=\{2,4,6,8\}$。这个划分是很容易从图上看出来的:$I=\{1,3,5,7\}$ 这四个单根之间互相是没有连线的,这对应于它们是互相正交的事实。同理 $J$ 也是。
注意 $I$ 对应的是矩阵的 $\{0,2,4,6\}$ 行,$J$ 对应的是矩阵的 $\{1,3,5,7\}$ 行。这是因为在计算机程序中,矩阵的下标都是从 0 开始的。
3. 我们断言:存住向量 $c=(c_1,c_2,\ldots,c_8)$ 使得
\[u=c_1\alpha_1+c_3\alpha_3+c_5\alpha_5+c_7\alpha_7,\quad v =c_2\alpha_2+c_4\alpha_4+c_6\alpha_6+c_8\alpha_8.\]
构成 Coxeter 平面的一组基。这个 $c$ 从何而来?它就是 Cartan 矩阵最大的特征值对应的特征向量。
4. 将上面得到的 $u,v$ 进行 Gram-Schimdt 正交化,再单位化,就得到了 Coxeter 平面的一组正交基。
Python 程序如下,我用英文写了注释。

#coding=utf-8


#----------------------------------
#This script draws the 2d projection of E8 root system
#into its Coxeter plane. For the math behind this script,
#see Humphreys‘s book "Reflection groups and Coxeter groups"
#section 17, chapter 3
#----------------------------------


import numpy as np
import matplotlib.pyplot as plt
from itertools import product, combinations

roots = []
#roots of the form (+-1,+-1,0,0,0,0,0,0)
for i,j in combinations(range(8),2):
    for x,y in product([-1,1],repeat=2):
        v = np.zeros(8)
        v[i] = x
        v[j] = y
        roots.append(v)

#roots of the form 1/2 * (+-1, +-1, ..., +-1)
for v in product([-1,1],repeat=8):
    if sum(v) % 4 == 0:
        roots.append(np.array(v)*0.5)

#get all edges
edges = []
for i in range(240):
    for j in range(i+1,240):
        if abs(np.sum((roots[i]-roots[j])**2)-2)<1e-8:
            edges.append([i,j])

print("There are %03d vertices and %04d edges"%(len(roots),len(edges)))
# choose a complete set of simple roots. They are copied from

#    https://en.wikipedia.org/wiki/E8_(mathematics)#Cartan_matrix

# These simple roots are given by the rows of the matrix delta.
delta = np.eye(8)
for i in range(5):
    delta[i,i+1] = -1
delta[5,6] = 1
delta[6] = -0.5
delta[7,5] = 1
delta[7,6] = -1
delta[7,7] = 0

print("The simple roots:")
print delta
"""
To costruct a bais of the coxeter plane, we fist split the simple roots
into two disjoint sets I and J. The roots in I are pairwise orthorgonal (and so is J).
By our choice they are I={0,2,4,6} and J={1,3,5,7}, which means for any pair
k,l in I (or in J), delta[k] and delta[l] are orthogonal.

The cartan matrix of E8 has a unique maximal positive eigenvalue with eigenvector c. Then
u = sum (c[i] * delta[i]) for i in I
v = sum (c[j] * delta[j]) for j in J
form a basis of the Coexter plane. Gram-Schimdt them, and project the root system to this plane. i.e. calculate the inner product <u,x>,<v,x> for all x in the root system, this is the 2d point we want.

The Dynkin graph:

     1---2---3---4---5---6---7
                     |
                     8
"""
I = [0,2,4,6]
J = [1,3,5,7]

#cartan matrix of the E8 root system
cartan = np.dot(delta,delta.transpose())
print "The cartan matrix:"
print cartan

eigenvals,eigenvecs= np.linalg.eigh(cartan)

#the eigenvalues returned by eigh() are in ascending order,
#and the eigenvectors are listed by columns.
#c is the eigenvector for the max-eigenvalue of the catan matrix.
c = eigenvecs[:,7]
print "The eigenvector for the maximal eigenvalue of the Cartan matrix:"
print c

#u, v form a basis of the coxeter plane.
u = np.sum([c[i]*delta[i] for i in I],axis=0)
v = np.sum([c[j]*delta[j] for j in J],axis=0)
print "A basis of the Coxeter plane:"
print u, v

# Gram-Schimdt. Then u,v are orthogonal unit vectors
u /= np.linalg.norm(u)
v = v - np.dot(u,v)*u
v /= np.linalg.norm(v)
print "u,v after Gram-Schimdt and normalized to unit vectors:"
print u,v

fig = plt.figure(figsize=(8,8),dpi=100)
ax = fig.add_axes([0,0,1,1],aspect=1)
ax.axis([-1.3,1.3,-1.3,1.3])
ax.axis(‘off‘)

def edge_color_map(x):
    if x < 0.3:
       return (0.75, 0.5, 0.25)
    elif x < 0.4:
        return (0, 0, 1)
    elif x < 0.5:
        return (1, 0, 1)
    elif x < 0.6:
        return (0, 1, 1)
    elif x < 0.75:
        return (1, 1, 0)
    elif x < 0.8:
        return (0, 1, 0)
    elif x < 1.0:
        return (0.5, 0.25, 0.75)
    else:
        return (1, 0, 0)

roots_2d = np.zeros((240,2))
modulus = np.zeros(240)
colors = np.zeros((240,3))
#project all roots to 2d by u,v
#and assign a color to each 2d point
for i in range(240):
    x = np.dot(roots[i],u)
    y = np.dot(roots[i],v)
    roots_2d[i] = [x,y]
    modulus[i] = np.linalg.norm([x,y])
    colors[i] = edge_color_map(modulus[i])

LineWidth = max(modulus)/8.0

#draw edges:
for e in edges:
    x = roots_2d[e[0]]
    y = roots_2d[e[1]]
    a, b = x
    c, d = y
    if modulus[e[0]] > modulus[e[1]]:
        color = colors[e[0]]
    else:
        color = colors[e[1]]
    ax.plot([a,c], [b,d],color=color,lw=LineWidth)

#draw vertices:
for i in range(240):
    x,y = roots_2d[i]
    ax.plot([x],[y],‘o‘,color=colors[i],ms=4)

plt.savefig("E8_root_system.png")
标签:
原文地址:http://www.cnblogs.com/xida/p/5313841.html