标签:
from sklearn import datasets
import numpy as np

X, y = datasets.make_blobs(n_features=2, centers=2)
from sklearn.svm import LinearSVC
from sklearn.svm import SVC

#测试两种不同的SVM,rbf的核真是太棒了

#svm = LinearSVC()
svm = SVC(kernel=‘rbf‘)
svm.fit(X, y)
‘‘‘
>>> y
array([1, 0, 1, 1, 0, 1, 0, 0, 1, 0, 1, 1, 0, 1, 0, 1, 1, 1, 0, 1, 0, 1, 0,
       0, 1, 0, 1, 1, 1, 1, 0, 1, 1, 1, 0, 1, 0, 0, 1, 1, 0, 0, 1, 1, 0, 0,
       0, 0, 0, 1, 0, 0, 0, 0, 1, 1, 0, 1, 1, 0, 1, 0, 0, 0, 0, 1, 0, 0, 0,
       1, 1, 0, 0, 1, 0, 1, 1, 0, 0, 1, 0, 1, 1, 1, 1, 1, 0, 0, 0, 1, 1, 0,
       1, 1, 1, 1, 0, 0, 0, 0])
>>> X[:5]
array([[ -7.16607012,   8.67278838],
       [ -1.9444707 ,   4.79203099],
       [ -8.13823925,   8.61203039],
       [ -8.46098709,  11.73701048],
       [ -0.72791284,   6.20893784]])
>>>
‘‘‘

‘‘‘
Now that we have fit the support vector machine,
we will plot its outcome at each point in the
graph.
This will show us the approximate decision boundary:
‘‘‘

from itertools import product
from collections import namedtuple
Point = namedtuple(‘Point‘, [‘x‘, ‘y‘, ‘outcome‘])


#寻找X轴、y轴的最小值和最大值
xmin, xmax = np.percentile(X[:, 0], [0, 100]) #等同 X[:,0].min()
ymin, ymax = np.percentile(X[:, 1], [0, 100])
‘‘‘
>>> X[:,0].min()
-10.02996504991013
>>> xmin
-10.02996504991013
>>> X[:,0].max()
1.6856669658909862
>>> xmax
1.6856669658909862
>>> X[:,1].min()
3.3455301726833886
>>> X[:,1].max()
11.737010478926441
‘‘‘
#对X,y取值范围内的任何一点,都用SVC进行预测,布成一张网
#下面的20指的是,在哪个取值范围内,选取多少个点
decision_boundary = []
for xpt, ypt in product(np.linspace(xmin-2.5, xmax+2.5, 50),np.linspace(ymin-2.5, ymax+2.5, 50)):
    #zz = svm.predict([xpt, ypt])
    p = Point(xpt, ypt, svm.predict([xpt, ypt]))
    decision_boundary.append(p)

import matplotlib.pyplot as plt
f, ax = plt.subplots(figsize=(7, 5))
import numpy as np
colors = np.array([‘r‘, ‘b‘])
for xpt, ypt, pt in decision_boundary:
    ax.scatter(xpt, ypt, color=colors[pt[0]], alpha=.15,s=50)
    #pt是一个数组,只有一个元素,就是预测的分类(0或1)
    #特别注意,这是背景色,注意alpha=.15,背景很淡
    ax.scatter(X[:, 0], X[:, 1], color=colors[y], s=30) #y是原始值,原始分类
    ax.set_ylim(ymin, ymax)
    ax.set_xlim(xmin, xmax)
    ax.set_title("A well separated dataset")
f.show()


#另外一个边界不清晰的例子
X, y = datasets.make_classification(n_features=2,n_classes=2,n_informative=2,n_redundant=0)
svm.fit(X, y)
xmin, xmax = np.percentile(X[:, 0], [0, 100])
ymin, ymax = np.percentile(X[:, 1], [0, 100])
test_points = np.array([[xx, yy] for xx, yy in product(np.linspace(xmin, xmax),np.linspace(ymin, ymax))])
test_preds = svm.predict(test_points)

import matplotlib.pyplot as plt
f, ax = plt.subplots(figsize=(7, 5))
import numpy as np
colors = np.array([‘r‘, ‘b‘])
ax.scatter(test_points[:, 0], test_points[:, 1],color=colors[test_preds], alpha=.25)
ax.scatter(X[:, 0], X[:, 1], color=colors[y])
ax.set_title("A well separated dataset")
f.show()
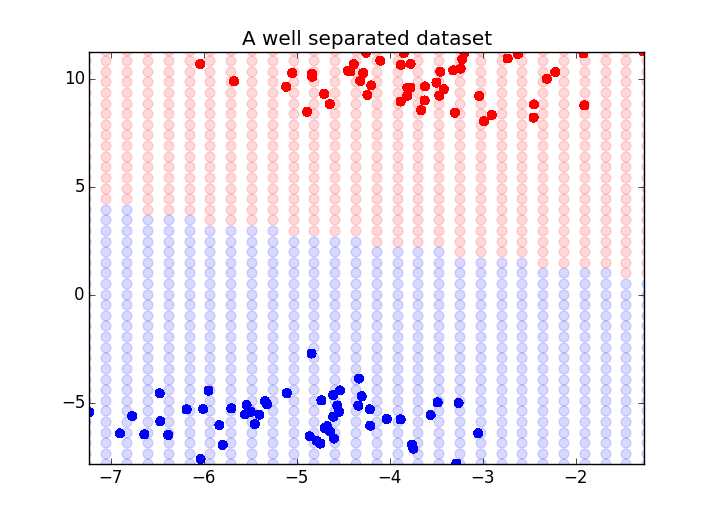
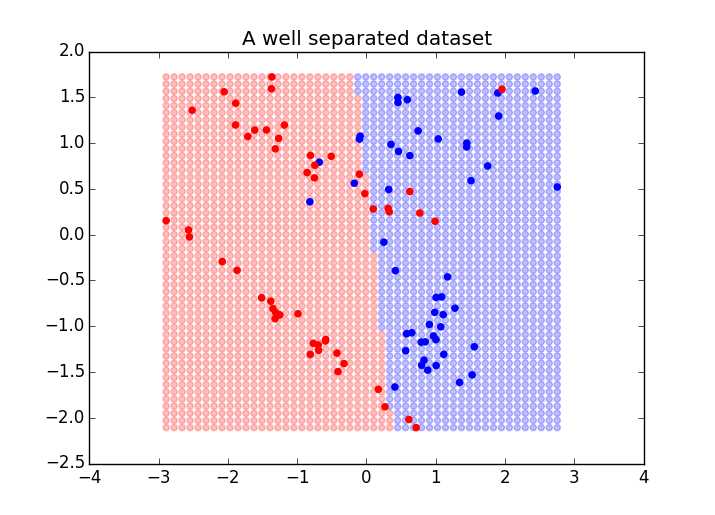
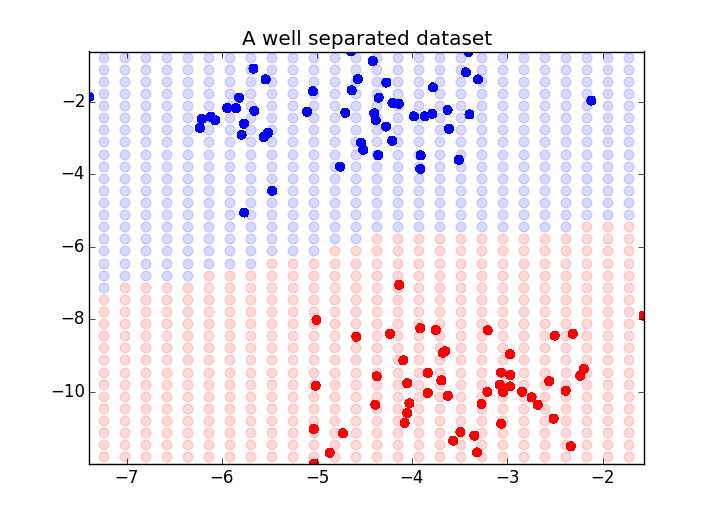
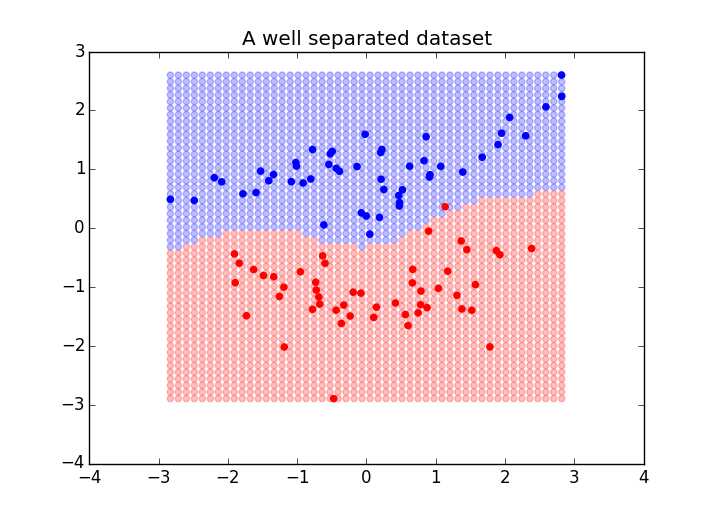
#测试两种不同的SVM,rbf的核真是太棒了(一种会拐弯的边界)
标签:
原文地址:http://www.cnblogs.com/qqhfeng/p/5343217.html