标签:
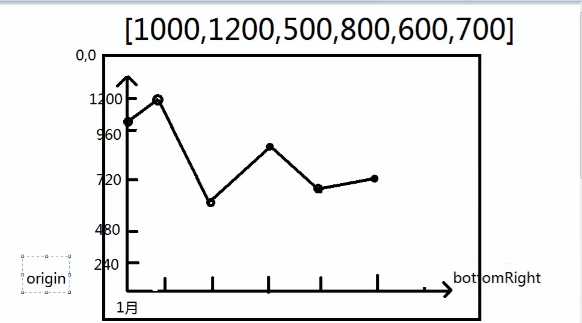
先分析确认起始坐标点


<!DOCTYPE HTML>
<html>
<head>
<title>New Document</title>
<meta charset="utf-8" />
<script src="jquery-1.11.1.js"></script>
</head>
<body>
    <div id="statContainer">
          <canvas id="statCanvas"
                  width="800" height="600">
              您的浏览器不支持Canvas
          </canvas>
      </div>
</body>
<script>
    /*页面加载完成后,向服务器请求当前用户的消费统计信息
     并输出在canvas图形中*/
    $(function () {
        $.getJSON(‘user-list.php‘, function (arr) {
            console.log(arr);
            drawStat(arr);
        })
    });
    //该函数用来绘制折线图
    function drawStat(arr) {
        var canvas = $(‘#statCanvas‘)[0];//获取dom对象
        var ctx = canvas.getContext(‘2d‘);
        //画布的款高
        var cw = canvas.width;
        var ch = canvas.height;
        //内间距padding
        var padding = 80;
        //原点,bottomRight:X轴终点,topLeft:Y轴终点
        var origin = {x:padding,y:ch-padding};
        var bottomRight = {x:cw-padding,y:ch-padding};
        var topLeft = {x:padding,y:padding};
        //绘制X轴
        ctx.beginPath();
        ctx.moveTo(origin.x,origin.y);
        ctx.lineTo(bottomRight.x,bottomRight.y);
        //绘制X轴箭头
        ctx.lineTo(bottomRight.x-20,bottomRight.y-10);
        ctx.moveTo(bottomRight.x,bottomRight.y);
        ctx.lineTo(bottomRight.x-20,bottomRight.y+10);
        //绘制Y轴
        ctx.moveTo(origin.x,origin.y);
        ctx.lineTo(topLeft.x,topLeft.y);
        //绘制Y轴箭头
        ctx.lineTo(topLeft.x-10,topLeft.y+20);
        ctx.moveTo(topLeft.x,topLeft.y);
        ctx.lineTo(topLeft.x+10,topLeft.y+20);
        //设置字号
        ctx.font = ‘16px SimHei‘;
        //绘制X方向刻度
        //计算刻度可使用的总宽度
        var avgWidth = (cw - 2*padding - 50)/(arr.length-1);
        for(var i=0;i<arr.length;i++){
            //循环绘制所有刻度线
            if(i > 0){
                //移动刻度起点
                ctx.moveTo(origin.x+i*avgWidth,origin.y);
                //绘制到刻度终点
                ctx.lineTo(origin.x+i*avgWidth,origin.y-10);
            }
            //X轴说明文字:1月,2月...
            var txtWidth = ctx.measureText(arr[i].key).width;
            ctx.fillText(
                    arr[i].key,
                    origin.x+i*avgWidth-txtWidth/2,
                    origin.y+32);
        }
        //绘制Y方向刻度
        //最大刻度max
        var max = 0;
        for(var i=0;i<arr.length;i++){
            if(arr[i].value>max){
                max=arr[i].value;
            }
        }
        console.log(max);

        /*var max = Math.max.apply(this,arr);
        console.log(max);*/
        var avgValue=Math.floor(max/5);
        var avgHeight = (ch-padding*2-50)/5;
        for(var i=1;i<arr.length;i++){
            //绘制Y轴刻度
                ctx.moveTo(origin.x,origin.y-i*avgHeight);
                ctx.lineTo(origin.x+10,origin.y-i*avgHeight);
            //绘制Y轴文字
            var txtWidth = ctx.measureText(avgValue*i).width;
            ctx.fillText(avgValue*i,
                    origin.x-txtWidth-5,
                    origin.y-i*avgHeight+6);
        }

        //绘制折线
        for(var i=0;i<arr.length;i++){
            var posY = origin.y - Math.floor(arr[i].value/max*(ch-2*padding-50));
            if(i==0){
                ctx.moveTo(origin.x+i*avgWidth,posY);
            }else{
                ctx.lineTo(origin.x+i*avgWidth,posY);
            }
            //具体金额文字
            ctx.fillText(arr[i].value,
                    origin.x+i*avgWidth,
                    posY
            )
        }
        ctx.stroke();
        //绘制折线上的小圆点
        ctx.beginPath();
        for(var i=0;i<arr.length;i++){
            var posY = origin.y - Math.floor(arr[i].value/max*(ch-2*padding-50));
            ctx.arc(origin.x+i*avgWidth,posY,4,0,Math.PI*2);//圆心,半径,画圆
            ctx.closePath();
        }
        ctx.fill();
    }
</script>
</html>
PHP数据代码
<?php
    //构造前台需要的最近几个月的消费统计信息
    $output = [];
    $output[] = [‘key‘=>‘3月‘,‘value‘=>3000];
    $output[] = [‘key‘=>‘4月‘,‘value‘=>2000];
    $output[] = [‘key‘=>‘5月‘,‘value‘=>0];
    $output[] = [‘key‘=>‘6月‘,‘value‘=>3500];
    $output[] = [‘key‘=>‘7月‘,‘value‘=>2800];
    $output[] = [‘key‘=>‘8月‘,‘value‘=>800];
    //返回json数据
    echo json_encode($output);
?>
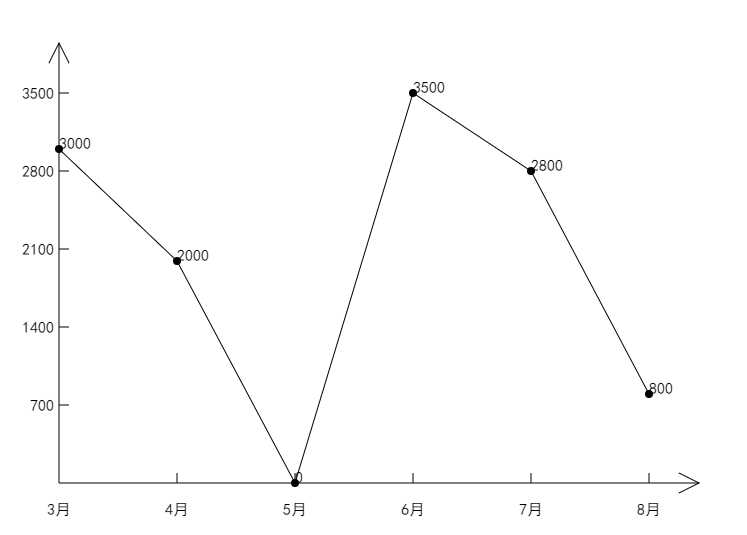
实现效果图
标签:
原文地址:http://www.cnblogs.com/liyuhuan/p/5459305.html