标签:
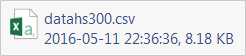
#构造数据。#datahs300.csv中存放的是时间和沪深300指数的对数收益率index300<-read.csv("datahs300.csv",header=T) #查看数据head(index300)#通过一个循环,构造一个标识列#对数收益率为正的,tagp值取作0#对数收益率为正的,tagp值取作1#将收益率转化为百分比 for(i in 1:length(index300[,2])){ if(index300[,2][i]<0){ index300$tagp[i]<-1 } else{ index300$tagp[i]<-0 } index300$lgreturn[i]<-index300$lgreturn[i]*100} #查看数据head(index300) TIME lgreturn tagp12015/01/053.0058359022015/01/06-0.0131821132015/01/070.0749501042015/01/08-2.3471691152015/01/09-0.3529425162015/01/12-0.93877721#导包library(ggplot2)library(ggthemes) #制作散点图testp<- ggplot(index300, aes(x =as.Date(TIME), y = lgreturn, colour = factor(tagp)))+ geom_point()testp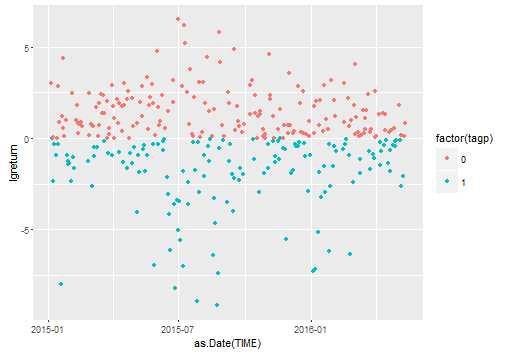
testp+theme_solarized_2()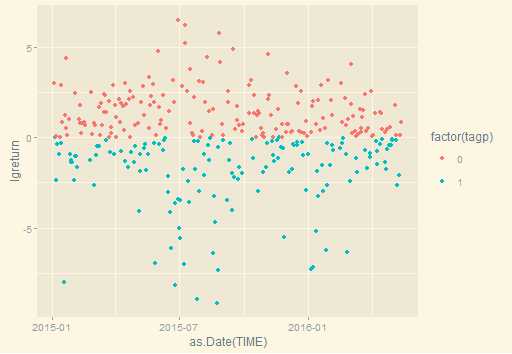
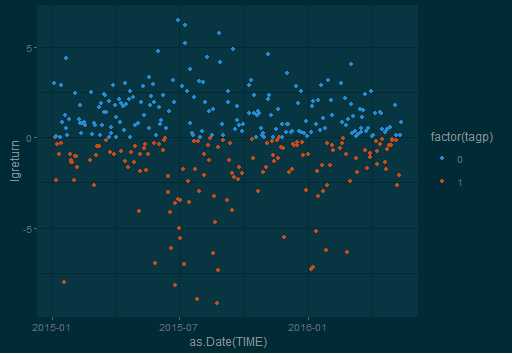
testp+theme_solarized(light = FALSE)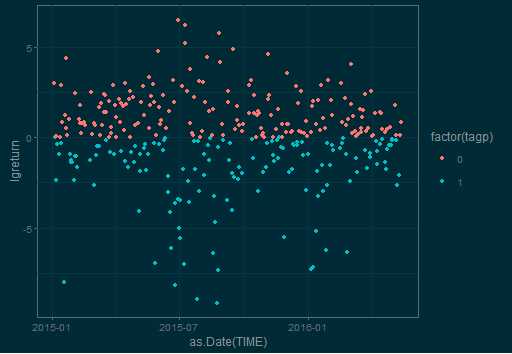
testp+theme_solarized(light = FALSE)+ scale_colour_solarized("blue")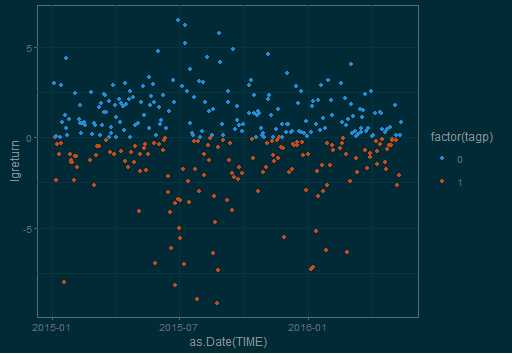
testp+ theme_solarized_2(light = FALSE) +
       scale_colour_solarized("blue")
testp+theme_economist()+ scale_colour_economist() 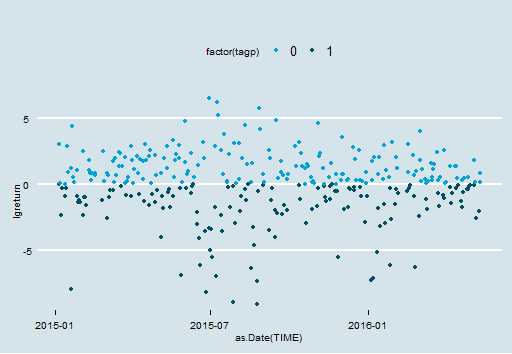
testp+geom_point()+ theme_solarized(light = FALSE)+ scale_colour_solarized("blue")+ geom_smooth(method ="loess")添加趋势线(lm/glm/gam/loess)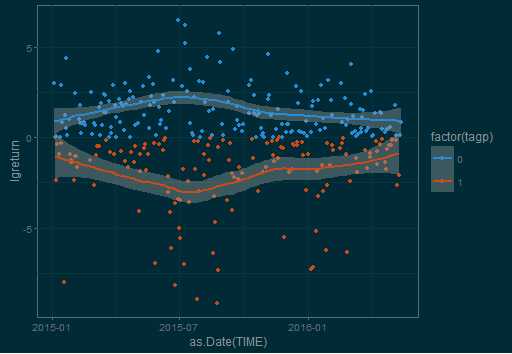
testp + ggtitle("logreturn")+ theme_wsj()+ scale_colour_wsj("colors6","")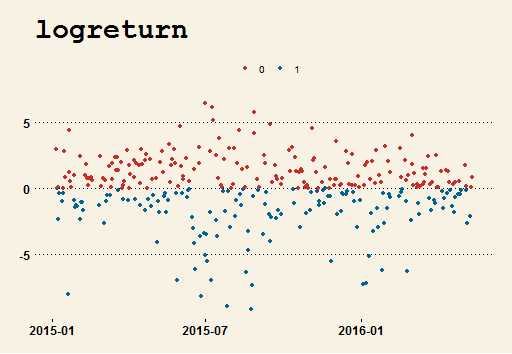
标签:
原文地址:http://www.cnblogs.com/xuanlvshu/p/5483945.html