标签:
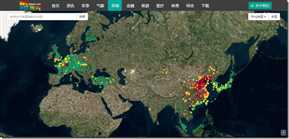
不管是百度地图还是高德地图,都很难得见到在地图上加载大量点要素,比如同屏1000的,因为这样客户端性能会很低,尤其是IE系列的浏览器,简直是卡的要死。但有的时候,还真的需要,比如,我要加载全球的AQI的测站和数据,这些站点在全球有4000多个,如何加载这些点并提高,OL3的ImageVector是一个很好地选择,简单的说,就是把这些要素渲染到一张图上,这样提高性能。代码如下:
//加载JSON数据
mainxiu.loaddata=function(options)
{
var that=this;
var styleCache = {};
var colors=[‘rgba(0, 153, 102, 0.99)‘,
‘rgba(255, 222, 51, 0.99)‘,
‘rgba(255, 153, 51, 0.99)‘,
‘rgba(204, 0, 51, 0.99)‘,
‘rgba(102, 0, 51, 0.99)‘,
‘rgba(126, 0, 35, 0.99)‘];
var createStyle = function(feature, resolution) {
var colorkey=0;
var reskey=2;
var dataval= parseFloat(feature.data.aqi);
if(dataval>=0 && dataval<=50)
{
colorkey=0;
}else if(dataval>50 && dataval<=100)
{
colorkey=1;
}
else if(dataval>100 && dataval<=150)
{
colorkey=2;
}
else if(dataval>150 && dataval<=200 )
{
colorkey=3;
}
else if(dataval>200 && dataval<=300 )
{
colorkey=4;
}
else
{
colorkey=5;
}
if(resolution<4)
{
reskey=16;
}else if(resolution<19)
{
reskey=12;
}
else if(resolution<76)
{
reskey=8;
}
else if(resolution<305)
{
reskey=6;
}
else
{
reskey=3;
}
var style = styleCache[colorkey+"-"+reskey];
if (!style) {
style = [new ol.style.Style({
image: new ol.style.Circle({
radius: reskey,
fill: new ol.style.Fill({
color: colors[colorkey],
})
})
})];
styleCache[colorkey+"-"+reskey]=style;
}
return style;
};
$.getJSON(options.url, function(result) {
var tmpLayer = that.getLayerById(options.id);
if (tmpLayer == null)
{
tmpLayer = new ol.layer.Image({
id: options.id,
opacity: 0.95,
maxzoom: 1224,
minzoom: 0.0001
});
that.olmap.addLayer(tmpLayer);
}
var features=[];
$(result).each(function(i, val) {
geom = new ol.geom.Point(ol.proj.transform([ parseFloat(val.g[1]), parseFloat(val.g[0]) ], ‘EPSG:4326‘, ‘EPSG:3857‘));
feature = new ol.Feature(geom);
features.push(feature);
feature.data = val;
});
// Source and vector layer
var vectorSource = new ol.source.Vector({
features : features
});
var vimage= new ol.source.ImageVector({
source:vectorSource,
});
vimage.setStyle(createStyle);
tmpLayer.setSource(null);
tmpLayer.setSource(vimage);
that.setLayerVisible(options.id, true);
});
};
大家可以不使用ImageVector进行显示对比一下性能:

使用ImageVector的方式,极大地提高了性能。另外如果是arcgis的话,使用WMS发布或许是一个更好的选择。因为grahpic加载这样的数据,性能确实是一个问题。
[原创.数据可视化系列之三]使用Ol3加载大量点数据
标签:
原文地址:http://www.cnblogs.com/songsgroup/p/5540139.html