标签:
 1 import numpy as np
 2 import matplotlib.pyplot as plt
 3 #a = np.matrix([[1,1.15],[1,1.9],[1,3.06],[1,4.66],[1,6.84],[1,7.95]])
 4 #b = np.matrix([[1.37],[2.4],[3.02],[3.06],[4.22],[5.42]])
 5 a = np.matrix([[1,2.104],  [1,1.416],      [1,1.534],      [1,0.852]])
 6 b = np.matrix([[0.460], [0.232], [0.315], [0.178]])
 7 xdata = a[:,1]
 8 ydata = b
 9 tempp =[]
10 def gradient(X_norm,y,theta,alpha,m,num_it):
11     temp=np.matrix([[float(0)],[float(0)]])
12     for i in range(0,num_it):
13         h=np.dot(X_norm,theta)
14         temp[0]=theta[0]-alpha/m*(np.sum(h-y))
15         temp[1]=theta[1]-alpha/m*((h-y).T*X_norm[:,1])
16         theta=temp
17         if i%100 == 0:
18             ypredict = xdata * temp[1] + temp[0]
19             tempp.append(plt.plot(xdata,ypredict))
20     return theta
21 c = gradient(a,b,np.matrix([[float(0)],[float(0)]]),float(0.2),float(4),1000)
22 #ypredict=xdata*c[0]+c[1]
23 print c
24 plt.scatter(xdata,ydata)
25 plt.legend(tempp)
26 plt.show()
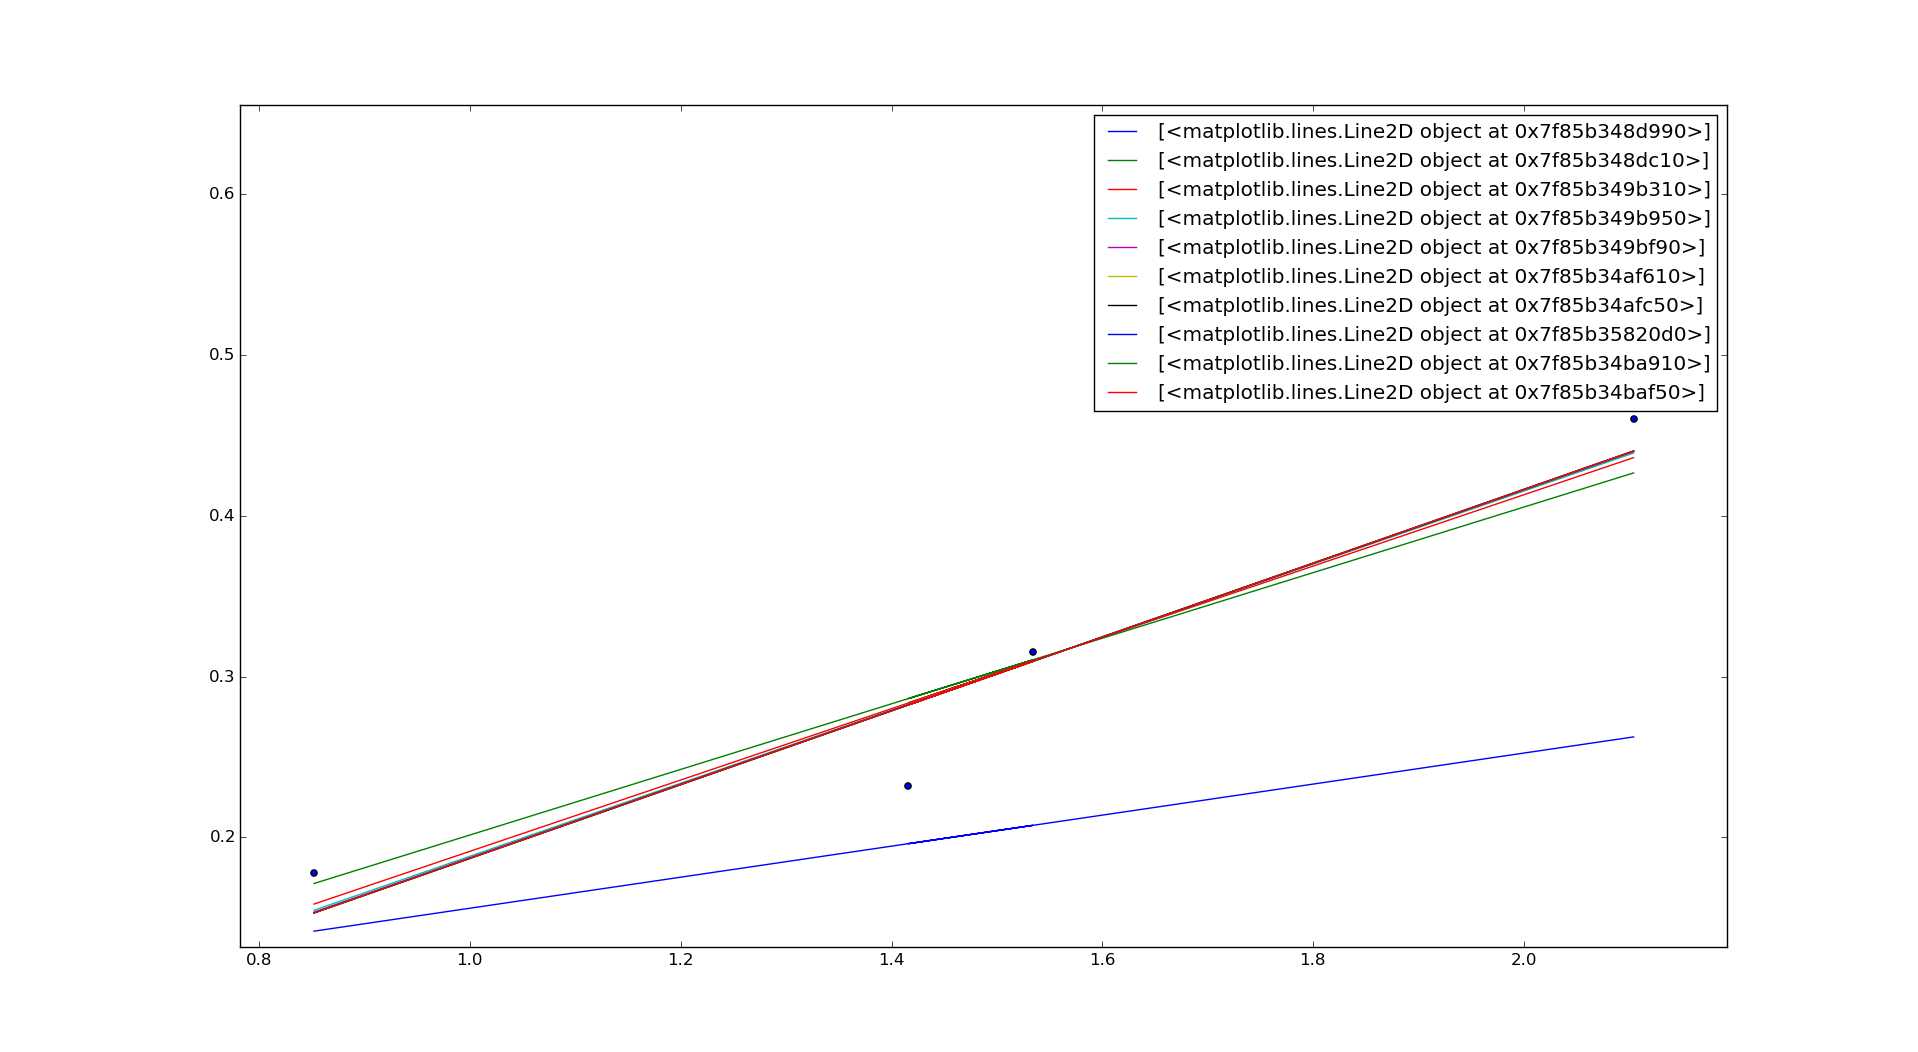
程序之后,就是结果:

标签:
原文地址:http://www.cnblogs.com/cruiser123/p/5560950.html