标签:
做过CRM系统的童鞋应该都或多或少接触过hicharts或者echarts等数据统计插件.用过这两款,个人感觉echarts的画面更好看.至于功能,只有适合自己的才是最好的.
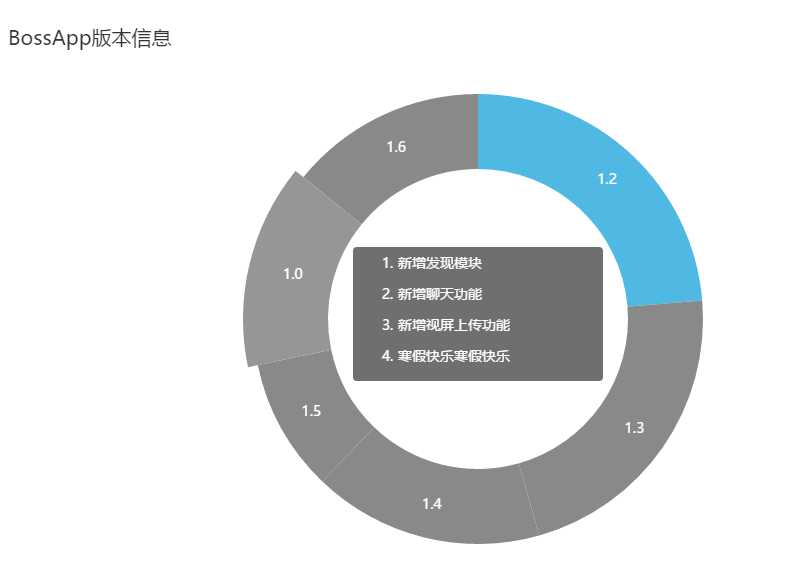
今天来说说我使用echarts的饼图的心得.
先给大家看一下简单地效果图:(鼠标移动到1.0时)
使用echarts,可以去官网 http://echarts.baidu.com/下载完整源码或者定制自己需要的模块.
使用起来很简单,首先先引用js源文件,再在js中初始化即可:
<script src="/js/echarts.js"></script>
<div id="main" style="width: 100%;height:600px;overflow: visible"></div>
<script>
var myChart = echarts.init(document.getElementById(‘main‘));//声明一个ehcarts对象
var option = {
    title : {//显示标题
        text: ‘BossApp版本信息‘,
        x:‘left‘,
        textStyle: {
            fontSize: ‘20‘,
            color:‘#333‘,
            fontWeight: ‘normal‘
        }
    },
    tooltip: {//鼠标移到模块上时,弹出框的内容
        trigger: ‘item‘,
        //formatter: "{a} <br/>{b}: {c} ({d}%)"
        //formatter: "{a} <br/>{b}"
        formatter: function (obj) {
            return obj.name.content
        }
    },
    //legend: {
    //    orient: ‘vertical‘,
    //    show:true,
    //    align: ‘left‘,
    //    data:["1.0","2.0","3.0","4.0","5.0","6.0"]
    //},
    series: [
        {
            name:‘版本信息‘,
            type:‘pie‘,
            //selectedMode: ‘single‘,
            radius: [‘50%‘, ‘75%‘],
            avoidLabelOverlap: false,
            label: {
                normal: {
                    formatter: function (obj) {
                        return obj.name.title
                    },
                    show: true,
                    position: ‘inner‘,//文字显示位置,如上图中的1.0,1.1字样
                    textStyle: {
                        fontSize: ‘14‘,
                        fontWeight: ‘normal‘
                    }
                },
                emphasis: {
                    //show: true,
                    position: ‘inner‘,
                    textStyle: {
                        fontSize: ‘14‘,
                        fontWeight: ‘normal‘
                    }
                }
            },
            color:[‘#4fb8e3‘,‘#898989‘,‘#898989‘,‘#898989‘,‘#898989‘,‘#898989‘],
            labelLine: {
                normal: {
                    show: true
                }
            },
            data:[
                //{value:335, name:‘1.0版本‘,selected:true},
                {value:335, name:{
                    title:versionInfo[5].version,
                    content:versionInfo[5].html
                }},
                {value:310, name:{
                    title:versionInfo[4].version,
                    content:versionInfo[4].html
                }},
                {value:234, name:{
                    title:versionInfo[3].version,
                    content:versionInfo[3].html
                }},
                {value:135, name:{
                    title:versionInfo[2].version,
                    content:versionInfo[2].html
                }},
                {value:200, name:{
                    title:versionInfo[1].version,
                    content:versionInfo[1].html
                }},
                {value:200, name:{
                    title:versionInfo[0].version,
                    content:versionInfo[0].html
                }}
            ]
        }
    ]
};
</script>
myChart.setOption(option);//配置生成的echarts,canvas的界面与有option决定

注意option的data这个属性.在官方文档上,都是写的data:[{value:100,name:ricky},{value:101,name:ricky1},.......],

然后tooltip默认的显示内容就为data里面的name属性.上面的例子中,versionInfo是一个变量,通过访问后台接口获取的一个对象.versionInfo有version与html这两个属性,假如你需要将versionInfo的html属性显示在tooltip中.怎么办呢?

我试过直接指定name:versionInfo.html.但是没有用.经过几次实验,发现将name当成一个对象进行处理,再设置tooltip的formatter,
formatter: function (obj) {
return obj.name.content
}
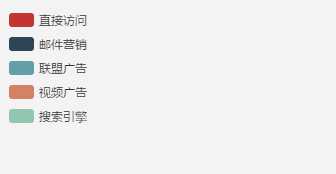
这样搞定了,但由于此时legend的data与series的data不一致,所以无法展示出下图的效果
标签:
原文地址:http://www.cnblogs.com/Ricky-Huang/p/5570576.html