标签:
示例图片,在网上下载一张图片如图:其中数据自定义
引入上节模版配置 在script标签中写代码:具体代码如下 信息将在代码中解释。
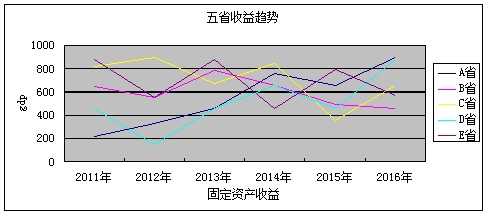
分析:“五省收益趋势”是标题;
x坐标为【2011年-2016年】、y坐标为【0-1000】,标题为gdp;
右侧为图例;
<!DOCTYPE>
<html lang=‘en‘>
<head>
<meta http-equiv="content-type" content="text/html;charset=utf-8">
<script src="../jquery-2.1.4/jquery.min.js"></script>
<script src="../Highcharts-4.2.5/js/highcharts.js"></script>
<script src="../Highcharts-4.2.5/js/themes/gray.js"></script><!--主题   网格 -->


<script>
$(function () {
    $(‘#container‘).highcharts({
        //chart:{type:‘spline‘},
        /************标题***************/
        //标题默认显示在图表的顶部,包括标题和副标题(subTitle),其中副标题是非必须的。
        //主标图
        title: {
            //标题文字水平对齐方式有,center,left,right,默认为center
            //标题文字垂直对齐方式,有top、middle、bottom可选 默认为空【""】
            text: ‘五省收益趋势‘, //标题文字用text表示
            x:-20,
            //隐藏标题    设置标题为null即可
            //text:null

            //text:‘<h1>Monthly Average Temperature</h1>‘,

            //useHTML:true,//是否解析html标签,设置解析后,可以使用例如a等html标签 默认是false

            //floating:true,//是否浮动,设置浮动后,标题将不占用图表区位置 默认是false

            //style:{},//文字样式,可以设置文字颜色、字体、字号,注意和css有略微的不同,例如font-size用fontSize、font-family用fontFamily表示

            //margin:80,//标题和图表区的间隔,当有副标题时,表示标题和副标题之间的间隔 默认是15

            //x: -200, //相对于水平对齐的偏移量,可以是负数,单位是px 默认是0

            //y: 20 //相对于垂直对齐的偏移量,可以使负数,单位是px 默认是0

        },
        //副标题
        //subtitle: {
        //    text: ‘Source: WorldClimate.com‘,
        //    x: -20
        //},

        /************坐标轴***************/
        //所有的图表除了饼图都有X轴和Y轴,默认情况下,x轴显示在图表的底部,y轴显示在左侧
        //(多个y轴时可以是显示在左右两侧),通过设置chart.inverted = true 可以让x,y轴显示位置对调
        xAxis: {
            categories: [‘2011年‘, ‘2012年‘, ‘2013年‘, ‘2014年‘, ‘2015年‘, ‘2016年‘] //categories
        },
        yAxis: {
            title: { text: ‘gdp‘ },//y轴标题
            plotLines: [{ value: 0, width: 1, color: ‘#808080‘ }] ,
            labels: {
                formatter:function(){
                  if(this.value <=100) {
                    return this.value;
                  }else if(this.value >100 && this.value <=200) {
                    return this.value;
                  }else {
                    return this.value;
                  }
                }
            }
        },


        /*************版权信息**********************/
        credits:{
             enabled:false // 禁用版权信息
        },

        /*************数据提示框**********************/
        //tooltip: { valueSuffix: ‘°C‘ },
        tooltip: {
            backgroundColor: ‘#FCFFC5‘,   // 背景颜色
            borderColor: ‘black‘,         // 边框颜色
            borderRadius: 10,             // 边框圆角
            borderWidth: 3,               // 边框宽度
            shadow: true,                 // 是否显示阴影
            animation: true ,              // 是否启用动画效果
            style: {                      // 文字内容相关样式
                color: "#ff0000",
                fontSize: "12px",
                fontWeight: "blod",
                fontFamily: "Courir new"
            }
        },


        /************图例***************/
        legend: {
            layout: ‘vertical‘,
            align: ‘right‘,
            verticalAlign: ‘middle‘,
            borderWidth: 0
        },


        /*****************数据列******************/
        series: [

            {
                name: ‘A省‘,//图例名称
                data: [200, 230, 190, 500, 600, 689]//数据
            },
            {
                name: ‘B省‘,
                data: [400, 700, 690, 590, 700, 780]
            },
            {
                name: ‘C省‘,
                data: [355, 230, 489, 609, 329, 800]
            },
            {
                name: ‘D省‘,
                data: [190, 234, 343, 444, 567, 787]
            },
            {
                name: ‘E省‘,
                data: [122, 345, 556, 778, 568, 888]
            }

        ]

    });
});
</script>


</head>


<body>
<div id="container" style="min-width:700px;height:400px"></div>
</body>

</html>

标签:
原文地址:http://www.cnblogs.com/jianyeLee/p/5634593.html