标签:
前几天看Apexpage的pdf看见了几个图形,为了省事直接抄了下来方便以后用
每一张图对应一组<apex:chart></apex:chart>标签,所以你想要哪个图就对应找第几个就好了,其实pdf上有,我只是把它摘抄下来方便以后使用。

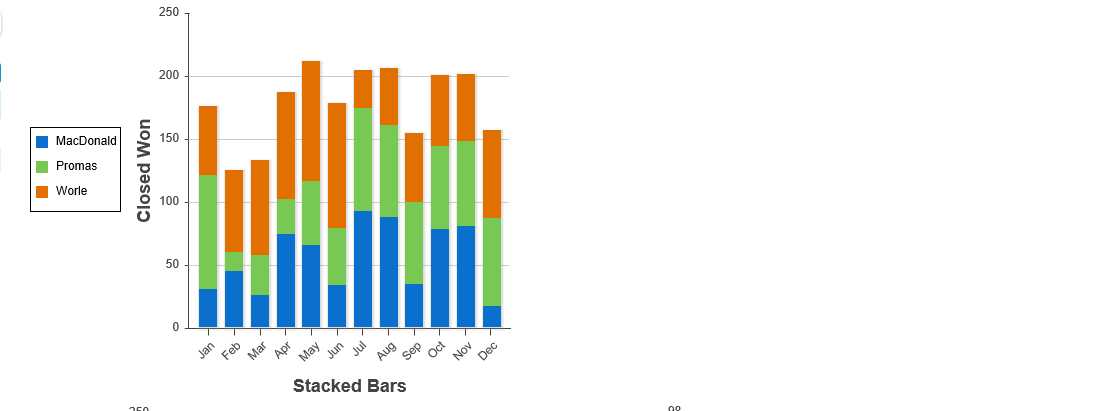
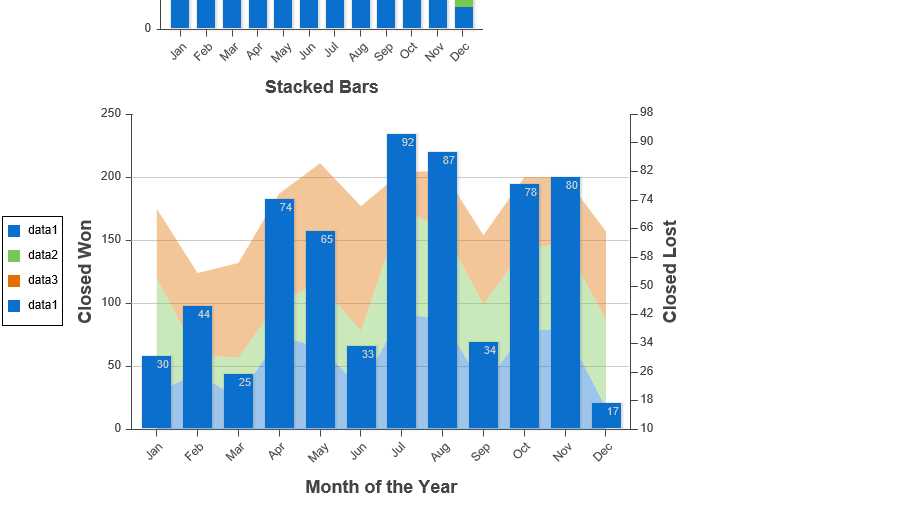
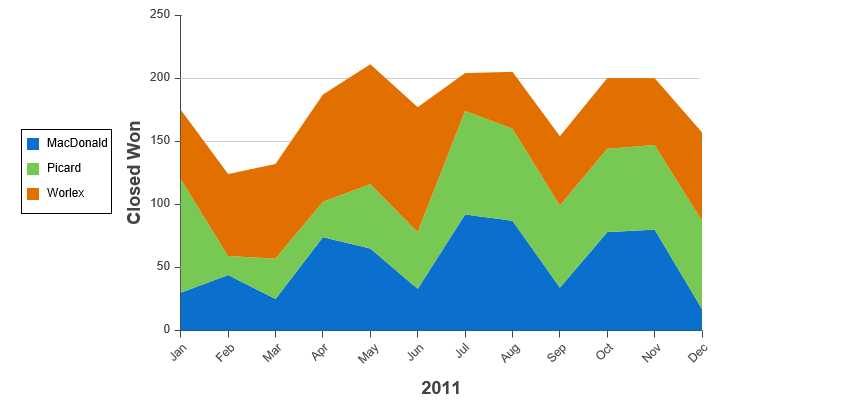
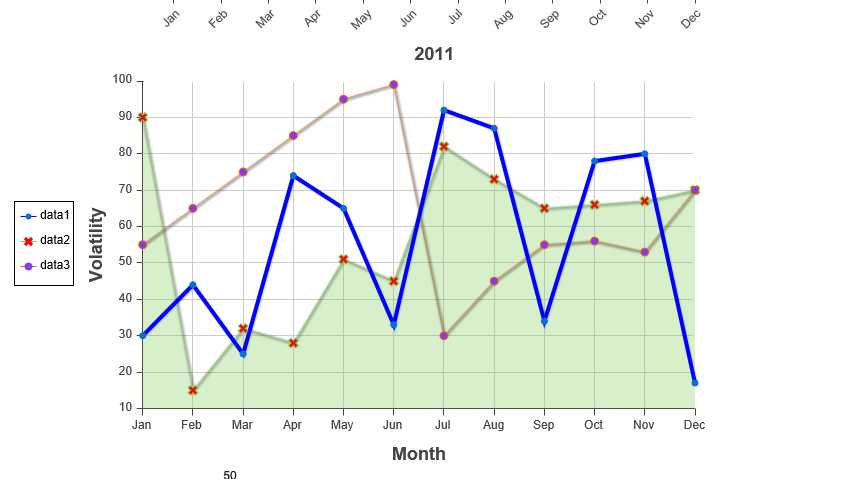
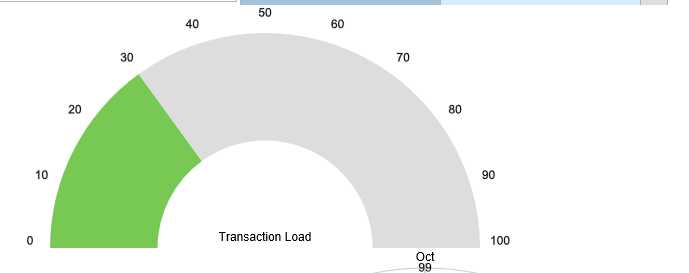
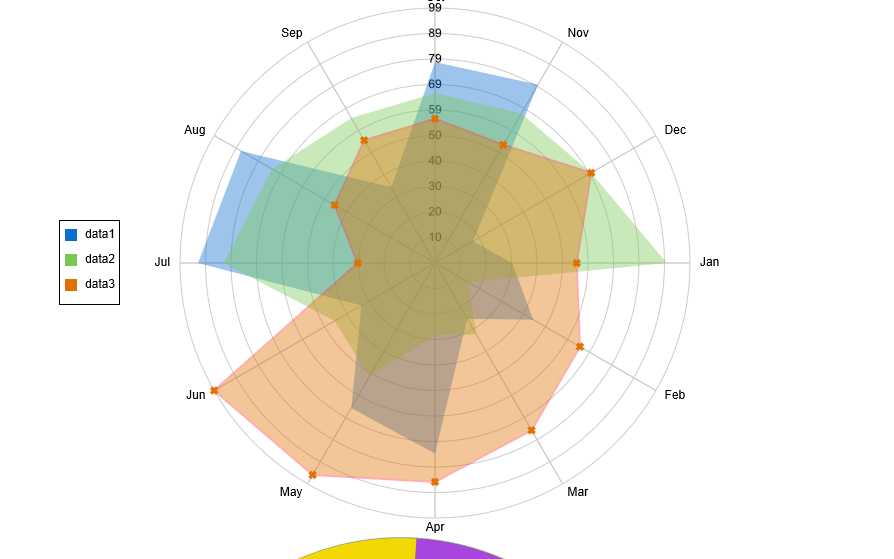
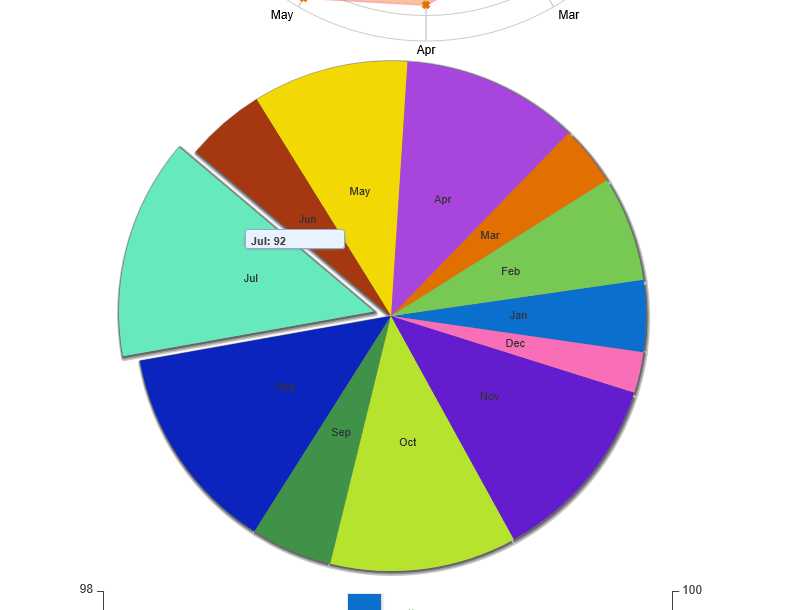
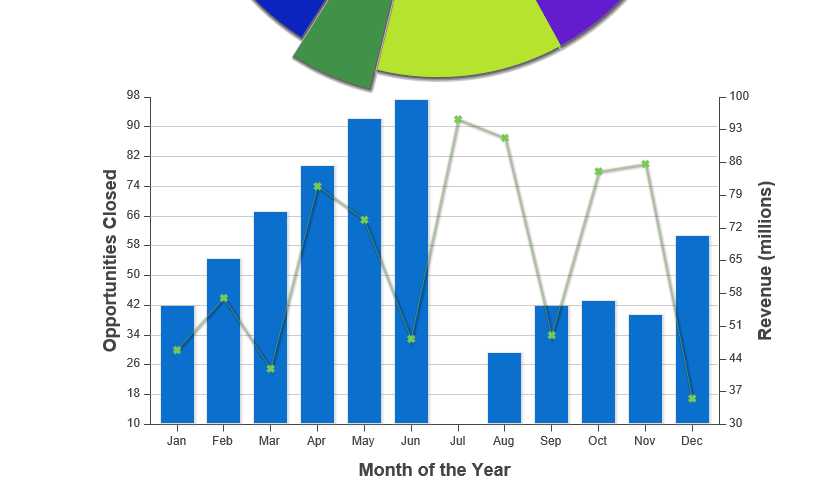
 1 <apex:page controller="ChartController">
 2
 3     <apex:chart data="{!A}" height="400" width="500">
 4         <apex:legend position="left"/>
 5         <apex:axis type="Numeric" position="left" title="Closed Won" grid="true" fields="data1,data2,data3" dashSize="2">
 6             <apex:chartLabel />
 7         </apex:axis>
 8         <apex:axis type="Category" position="bottom" fields="name" title="Stacked Bars">
 9             <apex:chartLabel rotate="315"/>
10         </apex:axis>
11         <apex:barSeries orientation="vertical" axis="left" stacked="true" xField="name" yField="data1,data2,data3" title="MacDonald,Promas,Worle"/>
12     </apex:chart>
13
14     <apex:chart height="400" width="700" animate="true" data="{!A}">
15         <apex:legend position="left"/>
16         <apex:axis type="Numeric" position="left" title="Closed Won" grid="true" fields="data1,data2,data3">
17             <apex:chartLabel />
18         </apex:axis>
19         <apex:axis type="Numeric" position="right" fields="data1" title="Closed Lost" />
20         <apex:axis type="Category" position="bottom" fields="name" title="Month of the Year">
21             <apex:chartLabel rotate="315"/>
22         </apex:axis>
23         <apex:areaSeries axis="left" tips="true" opacity="0.4" xField="name" yField="data1,data2,data3"/>
24         <apex:barSeries orientation="vertical" axis="right" xField="name" yField="data1">
25             <apex:chartLabel display="insideEnd" field="data1" color="#333"/>
26         </apex:barSeries>
27     </apex:chart>
28
29     <apex:chart height="400" width="700" animate="true" data="{!A}">
30         <apex:legend position="left"/>
31         <apex:axis type="Numeric" position="left" fields="data1,data2,data3" title="Closed Won" grid="true">
32             <apex:chartLabel />
33         </apex:axis>
34         <apex:axis type="Category" position="bottom" fields="name" title="2011">
35             <apex:chartLabel rotate="315"/>
36         </apex:axis>
37         <apex:areaSeries axis="left" xField="name" tips="true" yField="data1,data2,data3" title="MacDonald,Picard,Worlex" />
38     </apex:chart>
39
40
41     <apex:chart height="400" width="700" animate="true" legend="true" data="{!A}">
42         <apex:legend position="left"/>
43         <apex:axis type="Numeric" position="left" title="Volatility" grid="true" fields="data1,data2,data3">
44             <apex:chartLabel />
45         </apex:axis>
46         <apex:axis type="Category" position="bottom" title="Month" grid="true" fields="name">
47             <apex:chartLabel />
48         </apex:axis>
49         <apex:lineSeries axis="left" xField="name" yField="data1" strokeColor="#0000FF" strokeWidth="4"/>
50         <apex:lineSeries axis="left" fill="true" xField="name" yField="data2" markerType="cross" markerSize="4" markerFill="#FF0000"/>
51         <apex:lineSeries axis="left" xField="name" yField="data3" markerType="circle" markerSize="4" markerFill="#8E35EF">
52             <apex:chartTips height="20" width="120"/>
53         </apex:lineSeries>
54     </apex:chart>
55
56     <apex:chart height="250" width="450" animate="true" data="{!A}">
57         <apex:axis type="Gauge" position="gauge" title="Transaction Load" minimum="0" maximum="100" steps="10"/>
58         <apex:gaugeSeries dataField="data1" donut="50" colorSet="#78c953,#ddd"/>
59     </apex:chart>
60
61     <apex:chart height="530" width="700" legend="true" data="{!A}">
62         <apex:legend position="left"/>
63         <apex:axis type="Radial" position="radial">
64             <apex:chartLabel />
65         </apex:axis>
66         <apex:radarSeries xField="name" yField="data1" tips="true" opacity="0.4"/>
67         <apex:radarSeries xField="name" yField="data2" tips="true" opacity="0.4"/>
68         <apex:radarSeries xField="name" yField="data3" tips="true" markerType="cross" strokeWidth="2" strokeColor="#f33" opacity="0.4"/>
69     </apex:chart>
70
71
72     <apex:chart data="{!A}" height="530" width="700" legend="true">
73         <apex:pieSeries labelField="name" dataField="data1"/>
74     </apex:chart>
75
76
77     <apex:chart height="400" width="700" data="{!A}">
78         <apex:axis type="Numeric" position="left" fields="data1"
79             title="Opportunities Closed" grid="true"/>
80         <apex:axis type="Numeric" position="right" fields="data3"
81             title="Revenue (millions)"/>
82         <apex:axis type="Category" position="bottom" fields="name"
83             title="Month of the Year"/>
84         <apex:barSeries title="Monthly Sales" orientation="vertical" axis="right"
85             xField="name" yField="data3">
86             <apex:chartTips height="20" width="120"/>
87         </apex:barSeries>
88         <apex:lineSeries title="Closed-Won" axis="left" xField="name" yField="data1"/>
89     </apex:chart>
90 </apex:page>
 1 public with sharing class ChartController {
 2     //内部类
 3     public class Data {
 4
 5         public String name { get; set; }
 6         public Integer data1 { get; set; }
 7         public Integer data2 { get; set; }
 8         public Integer data3 { get; set; }
 9
10         public Data(String name, Integer data1, Integer data2, Integer data3) {
11             this.name = name;
12             this.data1 = data1;
13             this.data2 = data2;
14             this.data3 = data3;
15         }
16     }
17
18     public static List<Data> getA() {
19         List<Data> data = new List<Data>();
20
21         data.add(new Data(‘Jan‘, 30, 90, 55));
22         data.add(new Data(‘Feb‘, 44, 15, 65));
23         data.add(new Data(‘Mar‘, 25, 32, 75));
24         data.add(new Data(‘Apr‘, 74, 28, 85));
25         data.add(new Data(‘May‘, 65, 51, 95));
26         data.add(new Data(‘Jun‘, 33, 45, 99));
27         data.add(new Data(‘Jul‘, 92, 82, 30));
28         data.add(new Data(‘Aug‘, 87, 73, 45));
29         data.add(new Data(‘Sep‘, 34, 65, 55));
30         data.add(new Data(‘Oct‘, 78, 66, 56));
31         data.add(new Data(‘Nov‘, 80, 67, 53));
32         data.add(new Data(‘Dec‘, 17, 70, 70));
33
34         return data;
35     }
36 }
标签:
原文地址:http://www.cnblogs.com/panxing/p/5638602.html
