
标签:
"""
This example demonstrates the "ggplot" style, which adjusts the style to
emulate ggplot_ (a popular plotting package for R_).

These settings were shamelessly stolen from [1]_ (with permission).

.. [1] http://www.huyng.com/posts/sane-color-scheme-for-matplotlib/

.. _ggplot: http://had.co.nz/ggplot/
.. _R: http://www.r-project.org/

"""
import numpy as np
import matplotlib.pyplot as plt

plt.style.use(‘ggplot‘)

fig, axes = plt.subplots(ncols=2, nrows=2)
ax1, ax2, ax3, ax4 = axes.ravel()

# scatter plot (Note: `plt.scatter` doesn‘t use default colors)
x, y = np.random.normal(size=(2, 200))
ax1.plot(x, y, ‘o‘)

# sinusoidal lines with colors from default color cycle
L = 2*np.pi
x = np.linspace(0, L)
ncolors = len(plt.rcParams[‘axes.color_cycle‘])
shift = np.linspace(0, L, ncolors, endpoint=False)
for s in shift:
    ax2.plot(x, np.sin(x + s), ‘-‘)
ax2.margins(0)

# bar graphs
x = np.arange(5)
y1, y2 = np.random.randint(1, 25, size=(2, 5))
width = 0.25
ax3.bar(x, y1, width)
ax3.bar(x + width, y2, width, color=plt.rcParams[‘axes.color_cycle‘][2])
ax3.set_xticks(x + width)
ax3.set_xticklabels([‘a‘, ‘b‘, ‘c‘, ‘d‘, ‘e‘])

# circles with colors from default color cycle
for i, color in enumerate(plt.rcParams[‘axes.color_cycle‘]):
    xy = np.random.normal(size=2)
    ax4.add_patch(plt.Circle(xy, radius=0.3, color=color))
ax4.axis(‘equal‘)
ax4.margins(0)

plt.show()
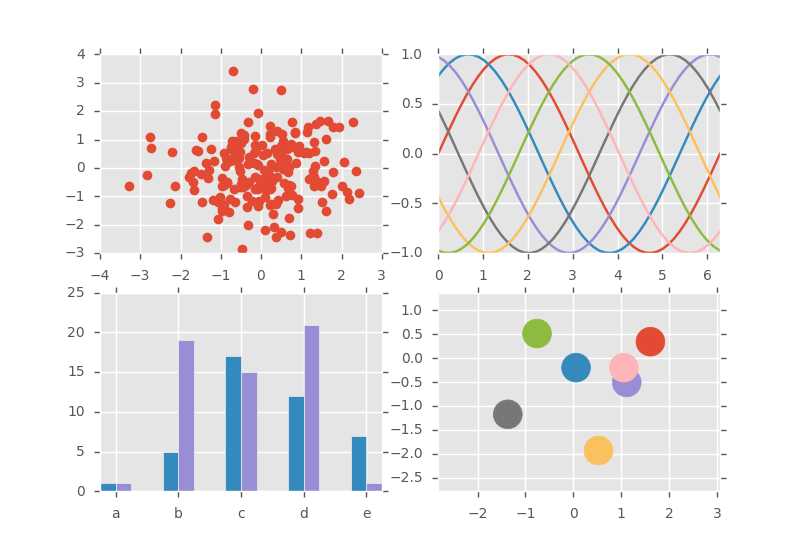
matplotlib.pyplot 中很好看的一种style
标签:
原文地址:http://www.cnblogs.com/lixiang-/p/5668164.html
