标签:
Highcharts是一款免费开源的纯javascript编写的图表库,能够很简单便捷的在Web网站或Web应用中添加交互性的图表,


<div id="container" style="min-width:800px;height:400px"></div>
$(‘#container‘).highcharts({                   //图表展示容器,与div的id保持一致
        chart: {
            type: ‘column‘                         //指定图表的类型,默认是折线图(line)
        },
        title: {
            text: ‘My first Highcharts chart‘      //指定图表标题
        },
        xAxis: {
            categories: [‘my‘, ‘first‘, ‘chart‘]   //指定x轴分组
        },
        yAxis: {
            title: {
                text: ‘something‘                  //指定y轴的标题
            }
        },
        series: [{                                 //指定数据列
            name: ‘Jane‘,                          //数据列名
            data: [1, 0, 4]                        //数据
        }, {
            name: ‘John‘,
            data: [5, 7, 3]
        }]
    });
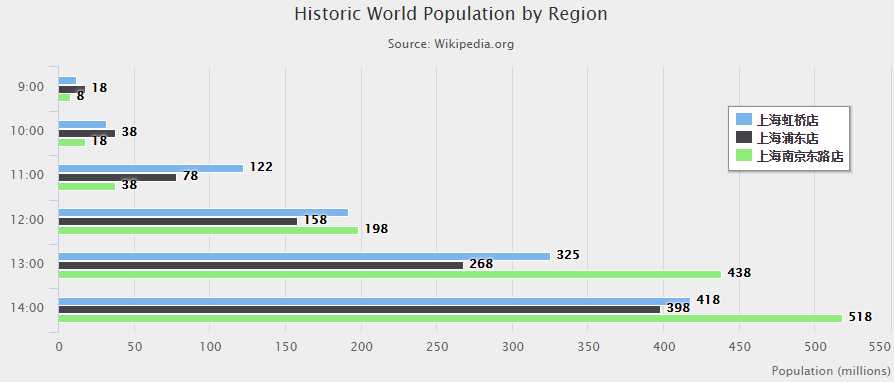
highchart的代码,都是json形式的,易于理解和开发,数据也可以用json来填充,下面举个自己做的例子看一看。
+----------+----------------+----------+-------------+
| store_id | store_name     | dur_flow | statis_time |
+----------+----------------+----------+-------------+
|        1 | 上海虹桥店     |       12 | 9:00        |
|        2 | 上海虹桥店     |       32 | 10:00       |
|        4 | 上海虹桥店     |      122 | 11:00       |
|        5 | 上海虹桥店     |      192 | 12:00       |
|        6 | 上海虹桥店     |      325 | 13:00       |
|        7 | 上海浦东店     |       18 | 9:00        |
|        8 | 上海浦东店     |       38 | 10:00       |
|        9 | 上海浦东店     |       78 | 11:00       |
|       10 | 上海浦东店     |      158 | 12:00       |
|       11 | 上海浦东店     |      268 | 13:00       |
|       12 | 上海南京东路店 |        8 | 9:00        |
|       13 | 上海南京东路店 |       18 | 10:00       |
|       13 | 上海南京东路店 |       38 | 11:00       |
|       14 | 上海南京东路店 |      198 | 12:00       |
|       15 | 上海南京东路店 |      438 | 13:00       |
|       16 | 上海南京东路店 |      518 | 14:00       |
|       17 | 上海浦东店     |      398 | 14:00       |
|       18 | 上海虹桥店     |      418 | 14:00       |
+----------+----------------+----------+-------------+
//后台取的数据,一个List<TestChart>
List<TestChart> dat = testChartService.selectStorData();
System.out.println(dat.toString());
writeJson(response, dat);
$(function () {
        $.ajax({
            type: ‘post‘,
            url: ‘<%=basePath%>storeData‘,
            async: true,
            cache: false,
            dataType: ‘json‘,
            success: function (data) {
                /*这种方式可以,但是感觉多次一举了*/
                /* var abc = [];
                 for(var i=0;i<data.length;i++){
                 var bcd={};
                 bcd.name=data[i].name;
                 bcd.data=data[i].data;
                 abc.push(bcd);
                 }*/
                /*这种方式尽管可以做到,但是毫无疑问太麻烦了!*/
                /*取店名(如果col里已经有店名了,就不在放进去,实现去重)*/
                var col = [];
                for (var i = 0; i < data.length; i++) {
                    if (col.indexOf(data[i].storeName) > -1) {
                        continue;
                    }
                    col.push(data[i].storeName);
                }
                /*取时间段,同理*/
                var xcate=[];
                for (var i = 0; i < data.length; i++) {
                    if (xcate.indexOf(data[i].statisTime) > -1) {
                        continue;
                    }
                    xcate.push(data[i].statisTime);
                }
                /*循环取出每个店的所有数据,分店存储为对象,再添加到一个array中,充当series的内容*/
                var alldat=[];
                for (var j = 0; j < col.length; j++) {
                    var each={};
                    var singledat = [];
                    for (var i = 0; i < data.length; i++) {
                        if (data[i].storeName == col[j]) {
                            singledat.push(data[i].durFlow);
                        }
                    }
                    each.name=col[j];
                    each.data=singledat;
                    alldat.push(each);
                }
                console.log(alldat);
                $(‘#container‘).highcharts({
                    chart: {
                        //type=bar为柱图,type=line为线图
                        type: ‘bar‘,
                        borderRadius: 6,
                        borderColor: ‘#4572A7‘,
                        backgroundColor: ‘#EEEEEE    ‘
                    },
                    title: {
                        text: ‘Historic World Population by Region‘
                    },
                    subtitle: {
                        text: ‘Source: Wikipedia.org‘
                    },
                    xAxis: {
                        categories: xcate,
                        title: {
                            text: null
                        }
                    },
                    yAxis: {
                        min: 0,
                        title: {
                            text: ‘Population (millions)‘,
                            align: ‘high‘
                        },
                        labels: {
                            overflow: ‘justify‘
                        }
                    },
                    tooltip: {
                        valueSuffix: ‘ millions‘
                    },
                    plotOptions: {
                        bar: {
                            dataLabels: {
                                enabled: true
                            }
                        }
                    },
                    legend: {
                        layout: ‘vertical‘,
                        align: ‘right‘,
                        verticalAlign: ‘top‘,
                        x: -40,
                        y: 100,
                        floating: true,
                        borderWidth: 1,
                        backgroundColor: ‘#FFFFFF‘,
                        shadow: true
                    },
                    credits: {
                        enabled: false
                    },
                    series: alldat
                });
            }
        });
    });
通过上面的一系列做法可以实现根据后台数据生成图表,但是过程比较麻烦,后面再寻求简化的办法。

----未完待续
标签:
原文地址:http://www.cnblogs.com/opensesame/p/5722821.html