Price of an asset or an ETF is of course the best indicator there is, but unfortunately there is only only so much information contained in it. Some people seem to think that the more indicators (rsi, macd, moving average crossover etc) , the better, but if all of them are based at the same underlying price series, they will all contain a subset of the same limited information contained in the price.
We need more information additional to what is contained the price to make a more informed guess about what is going to happen in the near future. An excellent example of combining all sorts of info to a clever analysis can be found on the The Short Side of Long blog. Producing this kind of analysis requires a great amount of work, for which I simply don‘t have the time as I only trade part-time.
So I built my own ‘market dashboard‘ that automatically collects information for me and presents it in an easily digestible form. In this post I‘m going to show how to build an indicator based on short volume data. This post will illustrate the process of data gathering and processing.
Step 1: Find data source.
BATS exchange provides daily volume data for free on their site.
Step 2: Get data manually & inspect
Short volume data of the BATS exchange is contained in a text file that is zipped. Each day has its own zip file. After downloading and unzipping the txt file, this is what‘s inside (first several lines):
In total a file contains around 6000 symbols.
This data is needs quite some work before it can be presented in a meaningful manner.
Step 3: Automatically get data
What I really want is not just the data for one day, but a ratio of short volume to total volume for the past several years, and I don‘t really feel like downloading 500+ zip files and copy-pasting them in excel manually.
Luckily, full automation is only a couple of code lines away:
First we need to dynamically create an url from which a file will be downloaded:
Output:
Now we can download multiple files at once:
Output:
Step 4. Parse downloaded files
We can use zip and pandas libraries to parse a single file:
It returns a ratio of Short Volume/Total Volume for all symbols in the zip file:
Now the only thing left is to parse all downloaded files and combine them to a single table and plot the result:
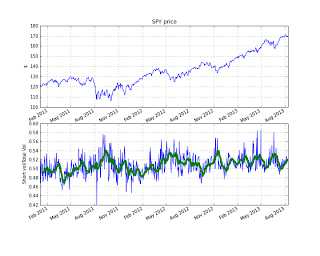 In the figure above I have plotted the average short volume ratio for the past two years. I also could have used a subset of symbols if I wanted to take a look at a specific sector or stock. Quick look at the data gives me an impression that high short volume ratios usually correspond with market bottoms and low ratios seem to be good entry points for a long position.
Starting from here, this short volume ratio can be used as a basis for strategy development.
We need more information additional to what is contained the price to make a more informed guess about what is going to happen in the near future. An excellent example of combining all sorts of info to a clever analysis can be found on the The Short Side of Long blog. Producing this kind of analysis requires a great amount of work, for which I simply don‘t have the time as I only trade part-time.
So I built my own ‘market dashboard‘ that automatically collects information for me and presents it in an easily digestible form. In this post I‘m going to show how to build an indicator based on short volume data. This post will illustrate the process of data gathering and processing.
Step 1: Find data source.
BATS exchange provides daily volume data for free on their site.
Step 2: Get data manually & inspect
Short volume data of the BATS exchange is contained in a text file that is zipped. Each day has its own zip file. After downloading and unzipping the txt file, this is what‘s inside (first several lines):
Date|Symbol|Short Volume|Total Volume|Market Center
20111230|A|26209|71422|Z
20111230|AA|298405|487461|Z
20111230|AACC|300|3120|Z
20111230|AAN|3600|10100|Z
20111230|AAON|1875|6156|Z
....
In total a file contains around 6000 symbols.
This data is needs quite some work before it can be presented in a meaningful manner.
Step 3: Automatically get data
What I really want is not just the data for one day, but a ratio of short volume to total volume for the past several years, and I don‘t really feel like downloading 500+ zip files and copy-pasting them in excel manually.
Luckily, full automation is only a couple of code lines away:
First we need to dynamically create an url from which a file will be downloaded:
|
1
2
3
4
5
6
7
8
9
10
|
from string import Templatedef createUrl(date): fName = ‘BATSshvol%s.txt.zip‘ % date.strftime(‘%Y%m%d‘) url = s.substitute(fName=fName, year=date.year, month=‘%02d‘ % date.month) return url,fName |
http://www.batstrading.com/market_data/shortsales/2013/08/BATSshvol20130813.txt.zip-dl?mkt=bzx
Now we can download multiple files at once:
|
1
2
3
4
5
6
7
8
9
10
|
import urllibfor i,date in enumerate(dates): source, fName = createUrl(date)# create url and file name dest = os.path.join(dataDir,fName) if not os.path.exists(dest): # don‘t download files that are present print ‘Downloading [%i/%i]‘ %(i,len(dates)), source urllib.urlretrieve(source, dest) else: print ‘x‘, |
Downloading [0/657] http://www.batstrading.com/market_data/shortsales/2011/01/BATSshvol20110103.txt.zip-dl?mkt=bzx
Downloading [1/657] http://www.batstrading.com/market_data/shortsales/2011/01/BATSshvol20110104.txt.zip-dl?mkt=bzx
Downloading [2/657] http://www.batstrading.com/market_data/shortsales/2011/01/BATSshvol20110105.txt.zip-dl?mkt=bzx
Downloading [3/657] http://www.batstrading.com/market_data/shortsales/2011/01/BATSshvol20110106.txt.zip-dl?mkt=bzx
Step 4. Parse downloaded files
We can use zip and pandas libraries to parse a single file:
|
1
2
3
4
5
6
7
8
9
10
11
12
13
|
import datetime as dtimport zipfileimport StringIOdef readZip(fName): zipped = zipfile.ZipFile(fName) # open zip file lines = zipped.read(zipped.namelist()[0]) # unzip and read first file buf = StringIO.StringIO(lines) # create buffer df = pd.read_csv(buf,sep=‘|‘,index_col=1,parse_dates=False,dtype={‘Date‘:object,‘Short Volume‘:np.float32,‘Total Volume‘:np.float32}) # parse to table s = df[‘Short Volume‘]/df[‘Total Volume‘] # calculate ratio s.name = dt.datetime.strptime(df[‘Date‘][-1],‘%Y%m%d‘) return s |
It returns a ratio of Short Volume/Total Volume for all symbols in the zip file:
Symbol
A         0.531976
AA        0.682770
AAIT      0.000000
AAME      0.000000
AAN       0.506451
AAON      0.633841
AAP       0.413083
AAPL      0.642275
AAT       0.263158
AAU       0.494845
AAV       0.407976
AAWW      0.259511
AAXJ      0.334937
AB        0.857143
ABAX      0.812500
...
ZLC       0.192725
ZLCS      0.018182
ZLTQ      0.540341
ZMH       0.413315
ZN        0.266667
ZNGA      0.636890
ZNH       0.125000
ZOLT      0.472636
ZOOM      0.000000
ZQK       0.583743
ZROZ      0.024390
ZSL       0.482461
ZTR       0.584526
ZTS       0.300384
ZUMZ      0.385345
Name: 2013-08-13 00:00:00, Length: 5859, dtype: float32
Step 5: Make a chart:
Now the only thing left is to parse all downloaded files and combine them to a single table and plot the result:

Starting from here, this short volume ratio can be used as a basis for strategy development.