标签:
 1 public class HProfTest {
 2     public void slowMethod() {
 3         try {
 4             Thread.sleep(1000);
 5         } catch (Exception e) {
 6             e.printStackTrace();
 7         }
 8     }
 9
10     public void slowerMethod() {
11         try {
12             Thread.sleep(10000);
13         } catch (Exception e) {
14             e.printStackTrace();
15         }
16     }
17
18     public static void main(String[] args) {
19         HProfTest test = new HProfTest();
20         test.slowerMethod();
21         test.slowMethod();
22     }
23 }
hprof命令以及其参数介绍:/* times:java函数的执行时间 hprof=cpu是针对cpu统计时间 interval=10 采样10次 */ -agentlib:hprof=cpu=times,interval=10
JAVA PROFILE 1.0.1, created Sat Sep 24 08:01:10 2016

Copyright (c) 2003, 2005, Oracle and/or its affiliates. All rights reserved.

Redistribution and use in source and binary forms, with or without
modification, are permitted provided that the following conditions
are met:

  - Redistributions of source code must retain the above copyright
    notice, this list of conditions and the following disclaimer.

  - Redistributions in binary form must reproduce the above copyright
    notice, this list of conditions and the following disclaimer in the
    documentation and/or other materials provided with the distribution.

  - Neither the name of Oracle nor the names of its
    contributors may be used to endorse or promote products derived
    from this software without specific prior written permission.

THIS SOFTWARE IS PROVIDED BY THE COPYRIGHT HOLDERS AND CONTRIBUTORS "AS
IS" AND ANY EXPRESS OR IMPLIED WARRANTIES, INCLUDING, BUT NOT LIMITED TO,
THE IMPLIED WARRANTIES OF MERCHANTABILITY AND FITNESS FOR A PARTICULAR
PURPOSE ARE DISCLAIMED.  IN NO EVENT SHALL THE COPYRIGHT OWNER OR
CONTRIBUTORS BE LIABLE FOR ANY DIRECT, INDIRECT, INCIDENTAL, SPECIAL,
EXEMPLARY, OR CONSEQUENTIAL DAMAGES (INCLUDING, BUT NOT LIMITED TO,
PROCUREMENT OF SUBSTITUTE GOODS OR SERVICES; LOSS OF USE, DATA, OR
PROFITS; OR BUSINESS INTERRUPTION) HOWEVER CAUSED AND ON ANY THEORY OF
LIABILITY, WHETHER IN CONTRACT, STRICT LIABILITY, OR TORT (INCLUDING
NEGLIGENCE OR OTHERWISE) ARISING IN ANY WAY OUT OF THE USE OF THIS
SOFTWARE, EVEN IF ADVISED OF THE POSSIBILITY OF SUCH DAMAGE.


Header for -agentlib:hprof (or -Xrunhprof) ASCII Output (JDK 5.0 JVMTI based)

WARNING!  This file format is under development, and is subject to
change without notice.

This file contains the following types of records:

THREAD START
THREAD END      mark the lifetime of Java threads

TRACE           represents a Java stack trace.  Each trace consists
                of a series of stack frames.  Other records refer to
                TRACEs to identify (1) where object allocations have
                taken place, (2) the frames in which GC roots were
                found, and (3) frequently executed methods.

HEAP DUMP       is a complete snapshot of all live objects in the Java
                heap.  Following distinctions are made:

                ROOT    root set as determined by GC
                CLS     classes
                OBJ     instances
                ARR     arrays

SITES           is a sorted list of allocation sites.  This identifies
                the most heavily allocated object types, and the TRACE
                at which those allocations occurred.

CPU SAMPLES     is a statistical profile of program execution.  The VM
                periodically samples all running threads, and assigns
                a quantum to active TRACEs in those threads.  Entries
                in this record are TRACEs ranked by the percentage of
                total quanta they consumed; top-ranked TRACEs are
                typically hot spots in the program.

CPU TIME        is a profile of program execution obtained by measuring
                the time spent in individual methods (excluding the time
                spent in callees), as well as by counting the number of
                times each method is called. Entries in this record are
                TRACEs ranked by the percentage of total CPU time. The
                "count" field indicates the number of times each TRACE
                is invoked.

MONITOR TIME    is a profile of monitor contention obtained by measuring
                the time spent by a thread waiting to enter a monitor.
                Entries in this record are TRACEs ranked by the percentage
                of total monitor contention time and a brief description
                of the monitor.  The "count" field indicates the number of
                times the monitor was contended at that TRACE.

MONITOR DUMP    is a complete snapshot of all the monitors and threads in
                the System.

HEAP DUMP, SITES, CPU SAMPLES|TIME and MONITOR DUMP|TIME records are generated
at program exit.  They can also be obtained during program execution by typing
Ctrl-\ (on Solaris) or by typing Ctrl-Break (on Win32).

--------

THREAD START (obj=50000191, id = 200002, name="HPROF gc_finish watcher", group="system")
THREAD START (obj=50000191, id = 200001, name="main", group="main")
THREAD END (id = 200001)
THREAD START (obj=50000191, id = 200003, name="DestroyJavaVM", group="main")
THREAD END (id = 200003)
TRACE 301758:
	HProfTest.slowerMethod(HProfTest.java:Unknown line)
	HProfTest.main(HProfTest.java:Unknown line)
TRACE 301759:
	HProfTest.slowMethod(HProfTest.java:Unknown line)
	HProfTest.main(HProfTest.java:Unknown line)
TRACE 301012:
	java.lang.AbstractStringBuilder.append(<Unknown Source>:Unknown line)
	java.lang.StringBuffer.append(<Unknown Source>:Unknown line)
	java.io.WinNTFileSystem.normalize(<Unknown Source>:Unknown line)
	java.io.WinNTFileSystem.normalize(<Unknown Source>:Unknown line)
TRACE 300936:
	java.lang.AbstractStringBuilder.append(<Unknown Source>:Unknown line)
	java.lang.StringBuilder.append(<Unknown Source>:Unknown line)
	sun.net.www.ParseUtil.decode(<Unknown Source>:Unknown line)
	sun.misc.URLClassPath$JarLoader.<init>(<Unknown Source>:Unknown line)
TRACE 301032:
	java.lang.CharacterDataLatin1.toLowerCase(<Unknown Source>:Unknown line)
	java.lang.Character.toLowerCase(<Unknown Source>:Unknown line)
	java.lang.String.toLowerCase(<Unknown Source>:Unknown line)
	java.io.WinNTFileSystem.hashCode(<Unknown Source>:Unknown line)
TRACE 300937:
	java.lang.StringBuilder.append(<Unknown Source>:Unknown line)
	sun.net.www.ParseUtil.decode(<Unknown Source>:Unknown line)
	sun.misc.URLClassPath$JarLoader.<init>(<Unknown Source>:Unknown line)
	sun.misc.URLClassPath$3.run(<Unknown Source>:Unknown line)
TRACE 300997:
	sun.net.www.ParseUtil.decode(<Unknown Source>:Unknown line)
	sun.misc.URLClassPath$JarLoader.<init>(<Unknown Source>:Unknown line)
	sun.misc.URLClassPath$3.run(<Unknown Source>:Unknown line)
	sun.misc.URLClassPath$3.run(<Unknown Source>:Unknown line)
TRACE 300356:
	java.lang.Character.toUpperCase(<Unknown Source>:Unknown line)
	java.lang.Character.toUpperCase(<Unknown Source>:Unknown line)
	java.lang.ProcessEnvironment$NameComparator.compare(<Unknown Source>:Unknown line)
	java.lang.ProcessEnvironment$NameComparator.compare(<Unknown Source>:Unknown line)
TRACE 300370:
	java.lang.ProcessEnvironment.<clinit>(<Unknown Source>:Unknown line)
	java.lang.System.getenv(<Unknown Source>:Unknown line)
	sun.usagetracker.UsageTrackerClient$2.run(<Unknown Source>:Unknown line)
	sun.usagetracker.UsageTrackerClient$2.run(<Unknown Source>:Unknown line)
TRACE 300357:
	java.lang.Character.toUpperCase(<Unknown Source>:Unknown line)
	java.lang.ProcessEnvironment$NameComparator.compare(<Unknown Source>:Unknown line)
	java.lang.ProcessEnvironment$NameComparator.compare(<Unknown Source>:Unknown line)
	java.util.TreeMap.put(<Unknown Source>:Unknown line)
TRACE 300338:
	java.lang.ProcessEnvironment$CheckedEntry.getKey(<Unknown Source>:Unknown line)
	java.util.AbstractMap.putAll(<Unknown Source>:Unknown line)
	java.util.TreeMap.putAll(<Unknown Source>:Unknown line)
	java.lang.ProcessEnvironment.<clinit>(<Unknown Source>:Unknown line)
TRACE 301036:
	java.lang.String.toLowerCase(<Unknown Source>:Unknown line)
	java.io.WinNTFileSystem.hashCode(<Unknown Source>:Unknown line)
	java.io.File.hashCode(<Unknown Source>:Unknown line)
	java.util.HashMap.hash(<Unknown Source>:Unknown line)
TRACE 301082:
	sun.misc.URLClassPath.getLoader(<Unknown Source>:Unknown line)
	sun.misc.URLClassPath.getNextLoader(<Unknown Source>:Unknown line)
	sun.misc.URLClassPath.getResource(<Unknown Source>:Unknown line)
	java.net.URLClassLoader$1.run(<Unknown Source>:Unknown line)
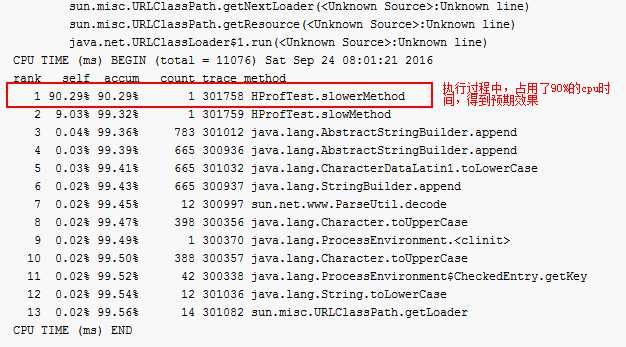
CPU TIME (ms) BEGIN (total = 11076) Sat Sep 24 08:01:21 2016
rank   self  accum   count trace method
   1 90.29% 90.29%       1 301758 HProfTest.slowerMethod
   2  9.03% 99.32%       1 301759 HProfTest.slowMethod
   3  0.04% 99.36%     783 301012 java.lang.AbstractStringBuilder.append
   4  0.03% 99.39%     665 300936 java.lang.AbstractStringBuilder.append
   5  0.03% 99.41%     665 301032 java.lang.CharacterDataLatin1.toLowerCase
   6  0.02% 99.43%     665 300937 java.lang.StringBuilder.append
   7  0.02% 99.45%      12 300997 sun.net.www.ParseUtil.decode
   8  0.02% 99.47%     398 300356 java.lang.Character.toUpperCase
   9  0.02% 99.49%       1 300370 java.lang.ProcessEnvironment.<clinit>
  10  0.02% 99.50%     388 300357 java.lang.Character.toUpperCase
  11  0.02% 99.52%      42 300338 java.lang.ProcessEnvironment$CheckedEntry.getKey
  12  0.02% 99.54%      12 301036 java.lang.String.toLowerCase
  13  0.02% 99.56%      14 301082 sun.misc.URLClassPath.getLoader
CPU TIME (ms) END

标签:
原文地址:http://www.cnblogs.com/aaronL/p/5902386.html