标签:
首先下载mschart.ocx文件,至于它所依赖的.net环境,网上有很多,本人下载的插件给出链接,http://www.cr173.com/soft/47300.html而它所依赖的环境可以从我的云盘中下载http://pan.baidu.com/s/1dETjpvj
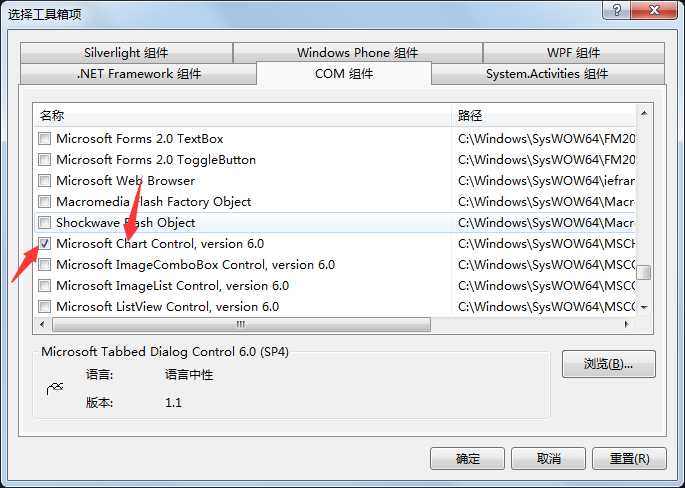
安装好后可以通过(1)regedit注册表查看一下是否安装成功。然后注册插件:regsvr32 +path+mschart.ocx 注意:以管理员运行cmd。(2)还可以通过vs编译器查看是否存在第三方插件:打开vs-->tool-->toolbox--->com。查找

勾选就可以在vs中使用该组件了。以上是mschart的安装。下面来看一下qt环境下的demo.

 1     /*
 2      * @Time :2016.9.29
 3      * @write by semon
 4      * @显示一个2d柱状图
 5     */
 6     QAxWidget *widget = new QAxWidget(this);
 7     widget->resize(size().width()-10,size().height()-10);
 8     widget->setControl(QString::fromUtf8("{31291E80-728C-11CF-93D5-0020AF99504A}"));
 9
10     pMsChart = new MsChart::_DMSChart(widget->asVariant().value<IDispatch*>());
11     pMsChart->SetTitleText("MsChart`s example");//设置标题
12     //设置背景颜色
13     pMsChart->Backdrop()->Fill()->SetStyle(MsChart::VtFillStyleBrush);
14     pMsChart->Backdrop()->Fill()->Brush()->FillColor()->Set(120,120,120);
15     //设置SeriesType
16     pMsChart->setChartType(MsChart::VtChChartType3dArea);//饼图
17 //    pMsChart->SetSeriesType(MsChart::VtChSeriesType2dLine);//2dLine
18     pMsChart->SetColumnCount(3);//y轴三条曲线
19     pMsChart->SetRowCount(3);//x轴三条曲线
20
21     //显示图例
22     pMsChart->SetShowLegend(true);
23     pMsChart->SetColumn(1);
24     pMsChart->SetColumnLabel("1号机");
25     pMsChart->SetColumn(2);
26     pMsChart->SetColumnLabel("2号机");
27     pMsChart->SetColumn(3);
28     pMsChart->SetColumnLabel("3号机");
29     //设置x轴
30     pMsChart->SetRow(1);
31     pMsChart->SetRowLabel("9.1");
32     pMsChart->SetRow(2);
33     pMsChart->SetRowLabel("9.2");
34     pMsChart->SetRow(3);
35     pMsChart->SetRowLabel("9.3");
36     //栈模式
37     pMsChart->SetStacking(false);
38     //y轴设置
39     //不自动标注x/y轴刻度
40     //设置成true时 y轴会自动根据熟知的额多少对y轴最大值进行修改
41     pMsChart->Plot()->Axis(MsChart::VtChAxisIdY)->ValueScale()->SetAuto(false);
42     pMsChart->Plot()->Axis(MsChart::VtChAxisIdX)->ValueScale()->SetAuto(false);
43
44     //y轴最大/最小刻度
45     pMsChart->Plot()->Axis(MsChart::VtChAxisIdY)->ValueScale()->SetMaximum(200);
46     pMsChart->Plot()->Axis(MsChart::VtChAxisIdY)->ValueScale()->SetMinimum(0);
47     //y轴刻度等分
48     pMsChart->Plot()->Axis(MsChart::VtChAxisIdY)->ValueScale()->SetMajorDivision(5);
49
50     //每刻度一个刻度线
51     //y轴
52     pMsChart->Plot()->Axis(MsChart::VtChAxisIdY)->ValueScale()->SetMinorDivision(1);
53     //x轴
54 //    pMsChart->Plot()->Axis(MsChart::VtChAxisIdX)->ValueScale()->SetMinorDivision(1);
55
56     //y轴名称
57     pMsChart->Plot()->Axis(MsChart::VtChAxisIdY)->AxisTitle()->SetText("Hours");
58     //x轴名称
59     pMsChart->Plot()->Axis(MsChart::VtChAxisIdX)->AxisTitle()->SetText("Time");
60     //y轴名称的排列方式
61     pMsChart->Plot()->Axis(MsChart::VtChAxisIdY)->AxisTitle()->TextLayout()->Orientation(/*1*/);
62     //线色
63     pMsChart->Plot()->SeriesCollection()->Item(1)->Pen()->VtColor()->Set(0,0,255);
64     pMsChart->Plot()->SeriesCollection()->Item(2)->Pen()->VtColor()->Set(0,255,0);
65     pMsChart->Plot()->SeriesCollection()->Item(3)->Pen()->VtColor()->Set(255,0,0);
66     //线宽(对点位图有效)
67 //    pMsChart->Plot()->SeriesCollection()->Item(1)->Pen()->SetWidth(10);
68 //    pMsChart->Plot()->SeriesCollection()->Item(2)->Pen()->SetWidth(20);
69 //    pMsChart->Plot()->SeriesCollection()->Item(3)->Pen()->SetWidth(30);
70     //设置隐藏第二Y轴不可用
71     pMsChart->Plot()->Axis(MsChart::VtChAxisIdY2)->AxisScale()->SetHide(true);
72     //设置数值
73     pMsChart->DataGrid()->SetData(1,1,57,0);
74     pMsChart->DataGrid()->SetData(2,1,100,0);
75     pMsChart->DataGrid()->SetData(1,2,100,0);
76     //pMsChart->Plot()->SeriesCollection()->Item(1)->SetSecondaryAxis(false);
77     //数据点类型显示数据值的模式(对柱状图和点线图有效)
78     //0表示不显示。1显示柱状图。2显示在柱状图内上方。3显示在柱状图内中间。4显示在柱状图内下方
79     pMsChart->Plot()->SeriesCollection()->Item(1)->DataPoints()->Item(-1)->DataPointLabel()->SetLocationType(MsChart::VtChLabelLocationTypeAbovePoint);
80     pMsChart->Plot()->SeriesCollection()->Item(2)->DataPoints()->Item(-1)->DataPointLabel()->SetLocationType(MsChart::VtChLabelLocationTypeAbovePoint);
81     pMsChart->Plot()->SeriesCollection()->Item(3)->DataPoints()->Item(-1)->DataPointLabel()->SetLocationType(MsChart::VtChLabelLocationTypeAbovePoint);
82     //不要与x轴垂直的表格线
83     pMsChart->Plot()->Axis(MsChart::VtChAxisIdX)->AxisGrid()->MajorPen()->SetStyle(MsChart::VtPenStyleNull);
84
85     pMsChart->Refresh();//更新插件
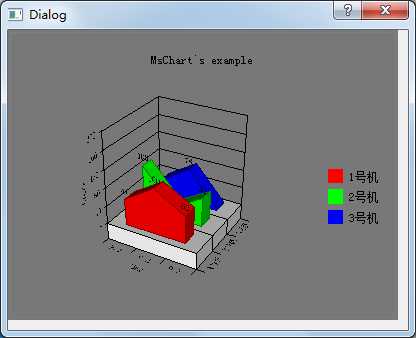
效果图如下:

想要改变样式:改变setChartType的值即可。
特别鸣谢:http://blog.csdn.net/u014023993/article/details/41542717
标签:
原文地址:http://www.cnblogs.com/first-semon/p/5919544.html