标签:
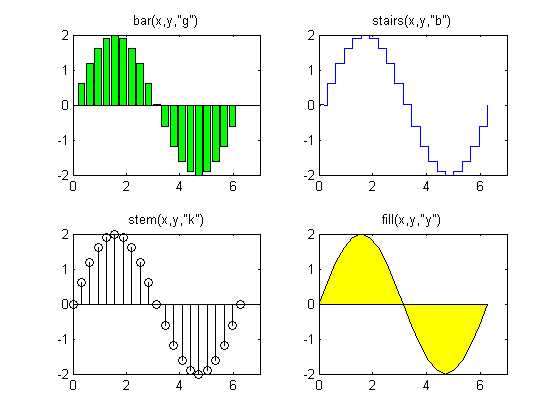
常见的二维统计分析图形:
x = 0:pi/10:2*pi;
y = 2*sin(x);
subplot(2,2,1);
bar(x,y,‘g‘);
title(‘bar(x,y,"g")‘);
axis([0,7,-2,2]);
subplot(2,2,2);
stairs(x,y,‘b‘);
title(‘stairs(x,y,"b")‘);
axis([0,7,-2,2]);
subplot(2,2,3);
stem(x,y,‘k‘);
title(‘stem(x,y,"k")‘);
axis([0,7,-2,2]);
subplot(2,2,4);
fill(x,y,‘y‘);
title(‘fill(x,y,"y")‘);
axis([0,7,-2,2]);

标签:
原文地址:http://www.cnblogs.com/CQBZOIer-zyy/p/5931428.html