标签:
To genereate a bar chart with matplotlib:
////////////////////////////////Import libraries and classes/////////////////////////////////////////////////////////////////////
import pandas as pd
import matplotlib.pyplot as plt
import seaborn as sns
import numpy as np
from pandas.tools.plotting import scatter_matrix
%matplotlib inline
////////////////////////////////Some practice for generating plot, bars and ticks/////////////////////////////////////////////////////////////////////
recent_grads = pd.read_csv("recent-grads.csv")
recent_grads.shape[0]
recent_grads = recent_grads.dropna(axis = 0)
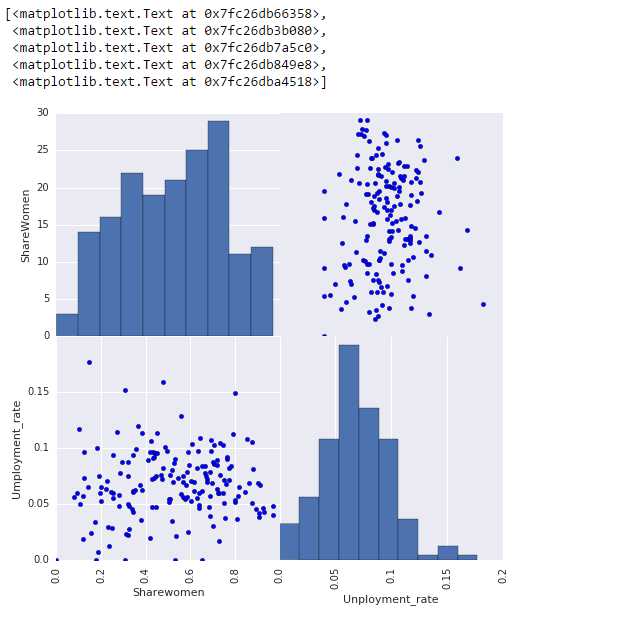
fig = plt.figure(figsize = (8,8))
ax1 = fig.add_subplot(2,2,1)
ax2 = fig.add_subplot(2,2,2)
ax3 = fig.add_subplot(2,2,3)
ax4 = fig.add_subplot(2,2,4)
ax1.hist(recent_grads["ShareWomen"])
ax2.scatter(recent_grads["Unemployment_rate"],recent_grads["ShareWomen"])
ax3.scatter(recent_grads["ShareWomen"],recent_grads["Unemployment_rate"])
ax4.hist(recent_grads["Unemployment_rate"])
ax1.xaxis.set_visible(False)
ax2.xaxis.set_visible(False)
ax2.yaxis.set_visible(False)
ax4.yaxis.set_visible(False)
ax1.set_ylabel("ShareWomen")
ax3.set_xlabel("Sharewomen")
ax3.set_ylabel("Umployment_rate")
ax4.set_xlabel("Unployment_rate")
fig.subplots_adjust(wspace=0,hspace=0)
ax1.set_ylim(0,30)
ax2.set_ylim(0,1)
ax3.set_xlim(0,1)
ax3.set_ylim(0,0.2)
ax4.set_xlim(0,0.2)
ax1.set_yticklabels([0,5,10,15,20,25,30])
ax3.set_yticklabels([0.00,0.05,0.10,0.15])
ax3.set_xticklabels([0.0,0.2,0.4,0.6,0.8],rotation=90)
ax4.set_xticklabels([0.00,0.05,0.10,0.15,0.20],rotation=90)

////////////////////////////////Generate a customized bar chart/////////////////////////////////////////////////////////////////////
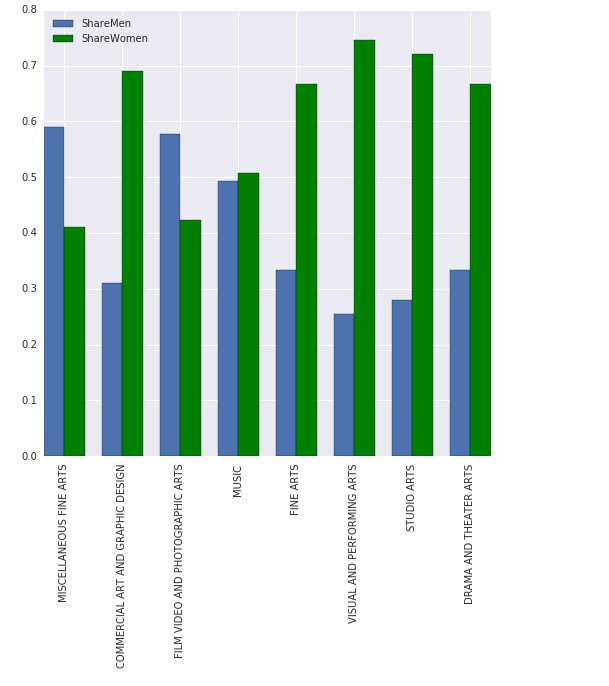
recent_grads["ShareMen"] = recent_grads["Men"]/recent_grads["Total"]
Arts_column = pd.DataFrame(recent_grads[recent_grads["Major_category"]=="Arts"])
Arts_fig = plt.figure(figsize=(8,8))
Arts_plot = Arts_fig.add_subplot(1,1,1)
locs = np.arange(len(Arts_column["Major"]))
offset_locs = locs + 0.35
Arts_plot.set_xticks(offset_locs)
Arts_plot.set_xticklabels(Arts_column["Major"].tolist(),rotation = 90)
bar_1 = Arts_plot.bar(locs,Arts_column["ShareMen"].tolist(),0.35)
bar_2 = Arts_plot.bar(offset_locs,Arts_column["ShareWomen"].tolist(),0.35,color = "green")
plt.legend((bar_1,bar_2),("ShareMen","ShareWomen"),loc = "upper left")
Arts_plot.grid(b="on",which = "major",axis = "both")

标签:
原文地址:http://www.cnblogs.com/kingoscar/p/5962596.html