标签:style blog http ar 2014 line log app
> which.max(apply(x[c("x1","x2","x3")], 1, sum))
49
> x$num[which.max(apply(x[c("x1","x2","x3")], 1, sum))]
[1] 2005138149
> hist(x$x1)
> plot(x$x1,x$x2)
> table(x$x1)
80 81 82 83 84 85 86 87 88 89 90 91 92 93 95 96 97 98 99 100
2 3 4 3 8 3 6 6 6 7 4 6 4 8 8 3 5 6 6 2
> barplot(table(x$x1))
> pie(table(x$x2))
> boxplot(x$x1, x$x2, x$x3)
> boxplot(x[2:4], col=c("red", "blue", "green"), notch=T)
> stars(x[c("x1","x2","x3")])
> stars(x[c("x1","x2","x3")],full=T, draw.segment=T)
> faces(x[c("x1","x2","x3")])
> stem(x$x1)
The decimal point is at the |
80 | 00000
82 | 0000000
84 | 00000000000
86 | 000000000000
88 | 0000000000000
90 | 0000000000
92 | 000000000000
94 | 00000000
96 | 00000000
98 | 000000000000
100 | 00
> stem(x$x2, scale = 1, width = 80, atom = 1e-08)
The decimal point is 1 digit(s) to the right of the |
6 | 23
6 | 7788889
7 | 00001222333444444
7 | 55666677777788888999
8 | 0000000000111122233333344444
8 | 5566666677778999
9 | 001112234
9 | 5
> stem(x$x3, scale = 1, width = 80, atom = 1e-08)
The decimal point is 1 digit(s) to the right of the |
3 | 9
4 |
5 | 0022346788
6 | 1112233344555667789
7 | 022223344444555667889
8 | 0122333444455677999
9 | 000112223345666777889
10 | 000000000
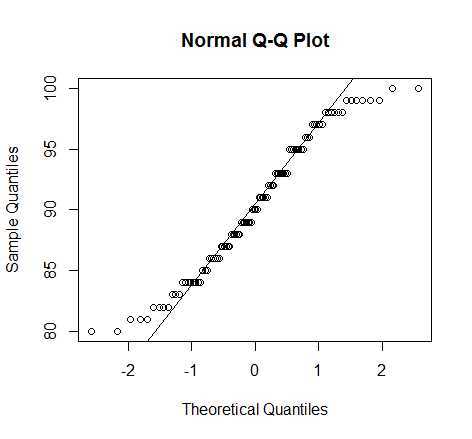
> qqnorm(x1)
> qqline(x1)
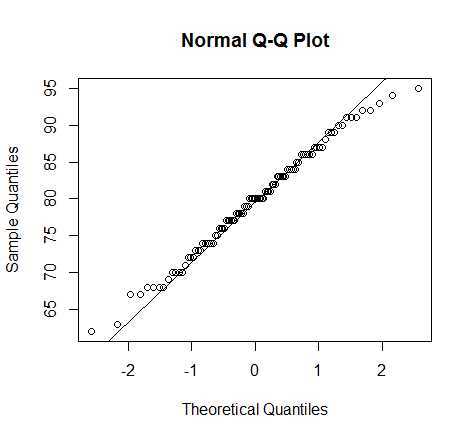
> qqnorm(x2)
> qqline(x2)
标签:style blog http ar 2014 line log app
原文地址:http://www.cnblogs.com/takeaction/p/3911389.html