标签:new range strong family blog 目录 get pack 环境
NumPy(Numeric Python)系统是Python的一种开源的数值计算扩展,一个用python实现的科学计算包。它提供了许多高级的数值编程工具,如:矩阵数据类型、矢量处理,以及精密的运算库。专为进行严格的数字处理而产生。内容包括:①一个强大的N维数组对象Array;②比较成熟的(广播)函数库;③用于整合C/C++和Fortran代码的工具包;④实用的线性代数、傅里叶变换和随机数生成函数。numpy和稀疏矩阵运算包scipy配合使用更加方便。
SciPy (Scientific Library for Python,pronounced "Sigh Pie") 是一个开源的数学、科学和工程计算包。它是一款方便、易于使用、专为科学和工程设计的Python工具包,包括统计、优化、整合、线性代数模块、傅里叶变换、信号和图像处理、常微分方程求解器等等。
Matplotlib是一个Python的图形框架,类似于MATLAB和R语言。它是python最著名的绘图库,它提供了一整套和matlab相似的命令API,十分适合交互式地进行制图。而且也可以方便地将它作为绘图控件,嵌入GUI应用程序中。
Scikit-Learn是基于python的机器学习模块,基于BSD开源许可。Scikit-learn的基本功能主要被分为六个部分,分类,回归,聚类,数据降维,模型选择,数据预处理,具体可以参考官方网站上的文档。
第一步:卸载原始版本,包括Numpy、Scipy、Matlotlib、Scikit-Learn
pip uninstall scikit-learn
pip uninstall numpy
pip uninstall scipy
pip uninstall matplotlib
第二步:不使用"pip install package"或"easy_install package"安装,或者去百度下载exe文件,而是去到官网下载相应版本,安装过程中最重要的地方就是版本需要兼容。
第三步:去到Python安装Scripts目录下,再使用pip install xxx.whl安装,先装Numpy\Scipy\Matlotlib包,再安装Scikit-Learn。
Numpy
下载地址:https://pypi.python.org/pypi/numpy/#downloads

这里我没有使用pip install numpy 进行安装,而是在Python的Scripts目录D:\Program Files\Python27\Scripts下使用
pip install D:\python64\numpy-1.11.2+mkl-cp27-cp27m-win_amd64.whl命令。


安装成功。
Scipy
下载地址:https://pypi.python.org/pypi/scipy/

安装命令:pip install D:\python64\scipy-0.18.1-cp27-cp27m-win_amd64.whl。


安装成功。
Matplotlib
下载地址:https://pypi.python.org/pypi/matplotlib/

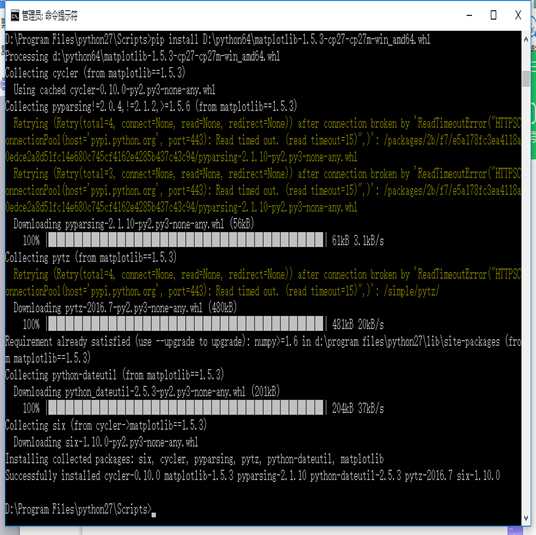
安装命令:pip install D:\python64\matplotlib-1.5.3-cp27-cp27m-win_amd64.whl。


安装成功。
Scikit-learn
下载地址:https://pypi.python.org/simple/scikit-learn/

安装命令:pip install D:\python64\scikit_learn-0.18-cp27-cp27m-win_amd64.whl


安装成功。
测试运行环境
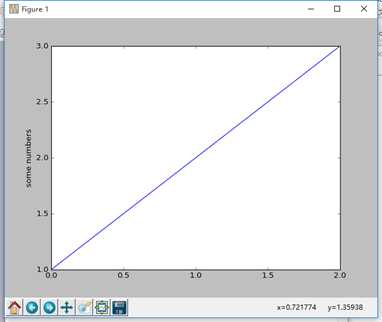
第一个代码:斜线坐标,测试matplotlib
import matplotlib
import numpy
import scipy
import matplotlib.pyplot as plt
plt.plot([1,2,3])
plt.ylabel(‘some numbers‘)
plt.show()
运行结果:

第二个代码:桃心程序,测试numpy和matplotlib
代码参考:Windows 下 Python easy_install 的安装 - KingsLanding
import numpy as np
import matplotlib.pyplot as plt
X = np.arange(-5.0, 5.0, 0.1)
Y = np.arange(-5.0, 5.0, 0.1)
x, y = np.meshgrid(X, Y)
f = 17 * x ** 2 - 16 * np.abs(x) * y + 17 * y ** 2 - 225
fig = plt.figure()
cs = plt.contour(x, y, f, 0, colors = ‘r‘)
plt.show()
运行结果:

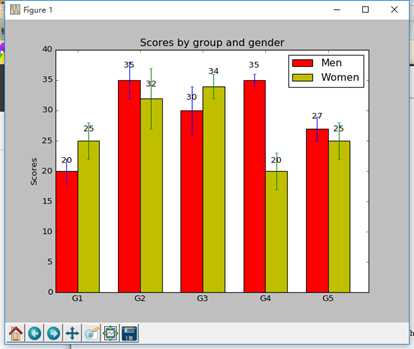
第三个程序:显示Matplotlib强大绘图交互功能
代码参考:Python-Matplotlib安装及简单使用 - bery
import numpy as np
import matplotlib.pyplot as plt
N = 5
menMeans = (20, 35, 30, 35, 27)
menStd = (2, 3, 4, 1, 2)
ind = np.arange(N) # the x locations for the groups
width = 0.35 # the width of the bars
fig, ax = plt.subplots()
rects1 = ax.bar(ind, menMeans, width, color=‘r‘, yerr=menStd)
womenMeans = (25, 32, 34, 20, 25)
womenStd = (3, 5, 2, 3, 3)
rects2 = ax.bar(ind+width, womenMeans, width, color=‘y‘, yerr=womenStd)
# add some
ax.set_ylabel(‘Scores‘)
ax.set_title(‘Scores by group and gender‘)
ax.set_xticks(ind+width)
ax.set_xticklabels( (‘G1‘, ‘G2‘, ‘G3‘, ‘G4‘, ‘G5‘) )
ax.legend( (rects1[0], rects2[0]), (‘Men‘, ‘Women‘) )
def autolabel(rects):
# attach some text labels
for rect in rects:
height = rect.get_height()
ax.text(rect.get_x()+rect.get_width()/2., 1.05*height, ‘%d‘%int(height),
ha=‘center‘, va=‘bottom‘)
autolabel(rects1)
autolabel(rects2)
plt.show()
运行结果:

第四个代码:矩阵数据集,测试sklearn
from sklearn import datasets
iris = datasets.load_iris()
digits = datasets.load_digits()
print digits.data
运行结果:

ImportError: numpy.core.multiarray failed to import
python安装numpy时出现的错误,这个通过stackoverflow和百度也是需要python版本与numpy版本一致,解决的方法包括"pip install -U numpy"升级或下载指定版本"pip install numpy==1.8"。但这显然还涉及到更多的包,没有前面的卸载下载安装统一版本的whl靠谱。
Microsoft Visual C++ 9.0 is required(unable to find vcvarsall.bat)
因为Numpy内部矩阵运算是用C语言实现的,所以需要安装编译工具,这和电脑安装的VC++或VS2012有关,解决方法:如果已安装Visual Studio则添加环境变量VS90COMNTOOLS即可,不同的VS版本对应不同的环境变量值:
Visual Studio 2010 (VS10)设置 VS90COMNTOOLS=%VS100COMNTOOLS%
Visual Studio 2012 (VS11)设置 VS90COMNTOOLS=%VS110COMNTOOLS%
Visual Studio 2013 (VS12)设置 VS90COMNTOOLS=%VS120COMNTOOLS%
但是这并没有解决,另一种方法是下载Micorsoft Visual C++ Compiler for Python 2.7的包。
PS:这些问题基本解决方法使用pip升级、版本一致、重新下载相关版本文件再安装。
numpy+scipy+matlotlib+scikit-learn的安装及问题解决
标签:new range strong family blog 目录 get pack 环境
原文地址:http://www.cnblogs.com/Sumomo0516/p/6013256.html