标签:hit title ati ges example nbsp gad images src
上代码
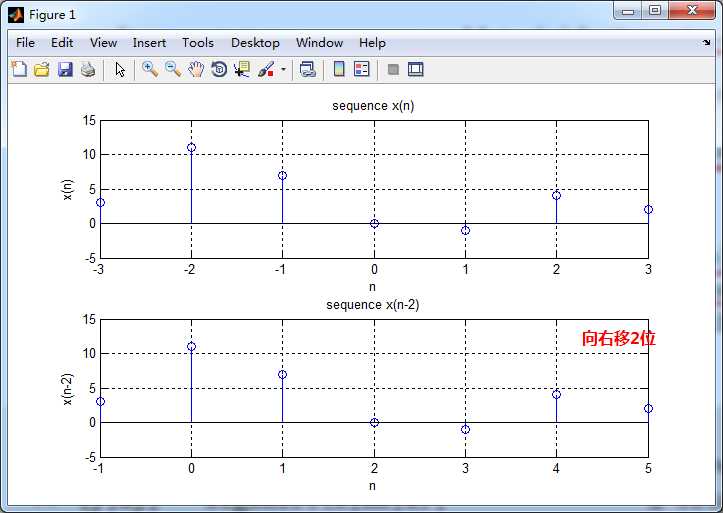
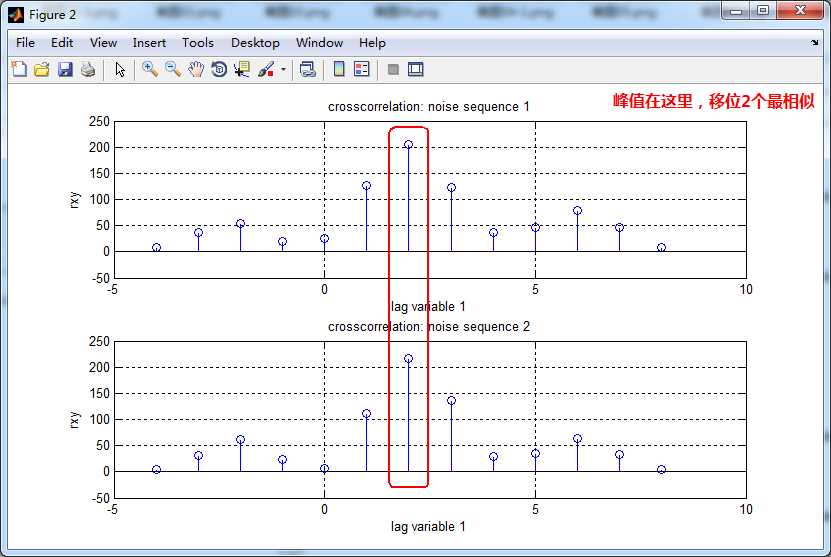
% noise sequence 1
x = [3, 11, 7, 0, -1, 4, 2]; nx = [-3:3];            % given signal x(n)
[y,ny] = sigshift(x,nx,2);                           % obtain x(n-2)

set(gcf,‘Color‘,‘white‘)
subplot(2,1,1);stem(nx,x); title(‘sequence x(n)‘);
xlabel(‘n‘);ylabel(‘x(n)‘); grid on
subplot(2,1,2);stem(ny,y);title(‘sequence x(n-2)‘)
xlabel(‘n‘);ylabel(‘x(n-2)‘); grid on

w = randn(1,length(y)); nw = ny;                     % generate w(n)
[y,ny] = sigadd(y,ny,w,nw);                          % obtain y(n)=x(n-2)+w(n)
[x,nx] = sigfold(x,nx);                              % obtain x(-n)
[rxy,nrxy] = conv_m(y,ny,x,nx);                      % crosscorrelation

figure
set(gcf,‘Color‘,‘white‘)
subplot(1,1,1), subplot(2,1,1); stem(nrxy,rxy);
axis([-5,10,-50,250]); xlabel(‘lag variable 1‘)
ylabel(‘rxy‘); title(‘crosscorrelation: noise sequence 1‘)
grid on
%
% noise sequence 2
x = [3, 11, 7, 0, -1, 4, 2]; nx = [-3:3];            % given signal x(n)
[y,ny] = sigshift(x,nx,2);                           % obtain x(n-2)
w = randn(1,length(y)); nw = ny;                     % generate w(n)
[y,ny] = sigadd(y,ny,w,nw);                          % obtain y(n)=x(n-2)+w(n)
[x,nx] = sigfold(x,nx);                              % obtain x(-n)
[rxy,nrxy] = conv_m(y,ny,x,nx);                      % crosscorrelation
subplot(2,1,2); stem(nrxy,rxy)
axis([-5,10,-50,250]);xlabel(‘lag variable 1‘)
ylabel(‘rxy‘); title(‘crosscorrelation: noise sequence 2‘)
grid on
结果:
DSP using MATlAB 示例Example2.10
标签:hit title ati ges example nbsp gad images src
原文地址:http://www.cnblogs.com/ky027wh-sx/p/6028701.html