标签:height 右上角 nump blob lin john color time 对象
matplotlib是python上的一个2D绘图库,它可以在夸平台上边出很多高质量的图像。综旨就是让简单的事变得更简单,让复杂的事变得可能。我们可以用matplotlib生成 绘图、直方图、功率谱、柱状图、误差图、散点图等 。
matplotlib的发明人为John Hunter(1968-2012),很不幸,他已经在癌症治疗过程中引起的综合症中去世。一代伟人有很多贡献,我们要缅怀他。如果我们从他的贡献中受益很大的话,请考虑为John Hunter Technology Fellowship 贡献你的力量。
下面的内容我们是基于matplotlib 版本1.5.3进行学习。
matplotlib在以后的工作与学习中有很大的用处,很有必要系统学习一下。
那就从画简单的图开始喽:
plot(*args, *kwargs)函数,它可以画出很简单线图,基本用法:
plot(x, y)        # 画出横轴为x与纵轴为y的图,使用默认的线形与颜色;
plot(x, y, ‘bo‘)  # 用蓝色,且点的标记用小圆,下面会解释哦
plot(y)           # 纵轴用y ,横轴用y的每个元素的坐标,即0,1,2……
plot(y, ‘r+‘)     #
#如果其中x或y 为2D的,则会用它的相应的每列来表示哦,是每列哦,是每列哦,是每列哦,(重要的事情说三遍)plot(x1, y1, ‘g^‘, x2, y2, ‘g-‘) #看到了吗,我们可以使用多对的x, y, format 对当作变量的哦,把它们画一个图里;
对于参数中,常用的format:线的颜色、线的形状、点的标记形状,我们用这三个的时候经常用缩写,它们之间的顺序怎么都可以哦,
如它俩一个意思:‘r+--‘、‘+--r‘。如果我们不想缩写的话,可以分别写成如: color=‘green‘, linestyle=‘dashed‘, marker=‘o‘。
线的形状:
‘-‘    solid line style
‘--‘    dashed line style
‘-.‘    dash-dot line style
‘:‘    dotted line style
点的标记:
‘.‘    point marker
‘,‘    pixel marker
‘o‘    circle marker
‘v‘    triangle_down marker
‘^‘    triangle_up marker
‘<‘    triangle_left marker
‘>‘    triangle_right marker
‘1‘    tri_down marker
‘2‘    tri_up marker
‘3‘    tri_left marker
‘4‘    tri_right marker
‘s‘    square marker
‘p‘    pentagon marker
‘*‘    star marker
‘h‘    hexagon1 marker
‘H‘    hexagon2 marker
‘+‘    plus marker
‘x‘    x marker
‘D‘    diamond marker
‘d‘    thin_diamond marker
‘|‘    vline marker
‘_‘    hline marker
线的颜色:
‘b’    blue
‘g’    green
‘r’    red
‘c’    cyan
‘m’    magenta
‘y’    yellow
‘k’    black
‘w’ white常见线的属性有:color,labor,linewidth,linestyle,maker,等,具体要看全的话,见:http://matplotlib.org/api/lines_api.html#matplotlib.lines.Line2D。
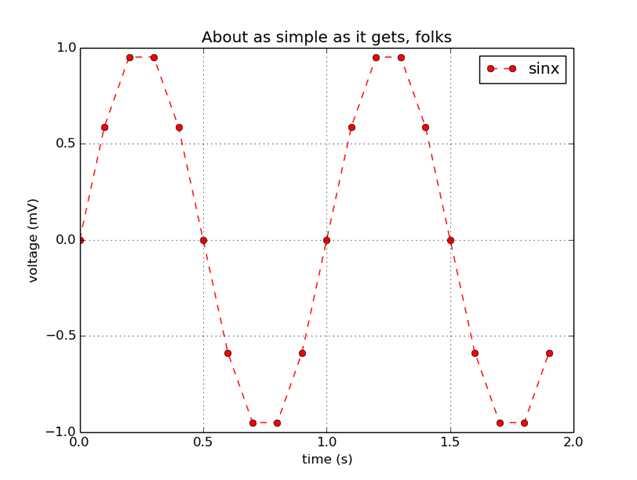
看一个例子:
import matplotlib.pyplot as plt
import numpy as np

plt.figure(1) #调用figure函数创建figure(1)对象,可以省略,这样那plot时,它就自动建一个啦;

t = np.arange(0.0, 2.0, 0.1)
s = np.sin(2*np.pi*t)
plt.plot(t, s, ‘r--o‘, label = ‘sinx‘)

plt.legend()  #显示右上角的那个label,即上面的label = ‘sinx‘
plt.xlabel(‘time (s)‘)    #设置x轴的label;
plt.ylabel(‘voltage (mV)‘)   #设置y轴的label;
plt.title(‘About as simple as it gets, folks‘)
plt.grid(True)   #显示网格;

plt.show()   #显示出figure;

画一个正统统图:
115 shared_ptr<Net<Dtype> > net_;
116 vector<shared_ptr<Net<Dtype> > > test_nets_;
net.blobs是一个字典元素:
key:为每一层网络的网络名字
值:为一个blob哦,可以返回data,diff, count, shape
net.params是一个字典元素;
key: 为每一层有参数的名字,
值 : 为一个blob的vetcor 哦;vector里的第一个元素为它主要的,第二个元素里面没能什么东西的。
标签:height 右上角 nump blob lin john color time 对象
原文地址:http://www.cnblogs.com/yinheyi/p/6056314.html