标签:数据集 intersect 数据分析 lines time 获取 font join point
http://blog.csdn.net/pipisorry/article/details/18010307
pandas的数据 结构:Series、DataFrame、索引对象
pandas基本功能:重新索引,丢弃指定轴上的项,索引、选取和过滤,算术运算和数据对齐,函数应用和映射,排序和排名,带有重复值的轴索引
pandas含有使数据分析工作变得更快更简单的高级数据结构和操作工具。它是基于NumPy构建的,让以NumPy为中心的应用变得更加简单。
通常建议你先学习NumPy,一个支持多维数组的库。但因为NumPy越来越成为一个被其他库所使用核心库,这些库通常具有更优雅的接口。使用NumPy(或者笨重的Matlab)达到同样的目的会很麻烦。
pandas可以以各种格式(包括数据库)输入输出数据、执行join以及其他SQL类似的功能来重塑数据、熟练地处理缺失值、支持时间序列、拥有基本绘图功能和统计功能,等等还有很多。
pandas空值的表示(None, np.NaN, np.NaT, pd.NaT)
NaN: not a number, NaN is the default missing value marker forreasons of computational speed and convenience, we need to be able to easilydetect this value with data of different types: floating point, integer,boolean, and general object.
None: treats None like np.nan. In many cases, however, the Python None will arise and we wish to also consider that “missing” or “null”.
NaT: Datetimes, For datetime64[ns] types, NaT represents missing values. This is a pseudo-native sentinel value that can be represented by numpy in a singular dtype (datetime64[ns]). pandas objects provide intercompatibility between NaT and NaN.
inf: Prior to version v0.10.0 inf and -inf were also considered to be “null” in computations. This is no longer the case by default; use the mode.use_inf_as_null option to recover it.
Note: 缺失值的判断要用np.isnan(),而不能使用a[0] == np.NaN.[numpy教程:逻辑函数Logic functions ]
pip install pandas
好像如果使用pd.read_excel要安装xlrd:pip install xlrd
import pandas as pd
import numpy as np
import matplotlib.pyplot as plt
pandas中的主要数据对象是Series和DataFrame。虽然它们不是没一个问题的通用解决方案,但提供了一个坚实的,易于使用的大多数应用程序的基础。
Series是一个一维的类似的数组对象,包含一个数组的数据(任何NumPy的数据类型)和一个与数组关联的数据标签,被叫做索引 。Seriers的交互式显示的字符串表示形式是索引在左边,值在右边。
lz通过使用series自带的函数,发现它和python dict类型太像了,基本一样!就如下所述:Series是一个定长的,有序的字典,因为它把索引和值映射起来了。它可以适用于许多需要一个字典的函数。
总结说就是,他像一个数组,你可以像数组那样索引,他也想一个字典,你可以像字典那样索引。
如果不给数据指定索引,一个包含整数0到 N-1 (这里N是数据的长度)的默认索引被创建。 你可以分别的通过它的values 和index 属性来获取Series的数组表示和索引对象:
最简单的Series是由一个数组的数据构成:
In [4]: obj = Series([4, 7, -5, 3])
In [5]: obj
Out[5]:
0 4
1 7
2 -5
3 3
In [6]: obj.values
Out[6]: array([ 4, 7, -5, 3])
In [7]: obj.index
Out[7]: Int64Index([0, 1, 2, 3])
通常,需要创建一个带有索引来确定每一个数据点的Series:
In [8]: obj2 = Series([4, 7, -5, 3], index=[‘d‘, ‘b‘, ‘a‘, ‘c‘])
In [9]: obj2
Out[9]:
d 4
b 7
a -5
c 3
另一种思考的方式是,Series是一个定长的,有序的字典,因为它把索引和值映射起来了。它可以适用于许多需要一个字典的函数:
In [18]: ‘b‘ in obj2
Out[18]: True
In [19]: ‘e‘ in obj2
Out[19]: False
如果你有一些数据在一个Python字典中,你可以通过传递字典来从这些数据创建一个Series:
In [20]: sdata = {‘Ohio‘: 35000, ‘Texas‘: 71000, ‘Oregon‘: 16000, ‘Utah‘: 5000}
In [21]: obj3 = Series(sdata)
只传递一个字典的时候,结果Series中的索引将是排序后的字典的建。
In [23]: states = [‘California’, ‘Ohio’, ‘Oregon’, ‘Texas’]
In [24]: obj4 = Series(sdata, index=states)
In [25]: obj4
Out[25]:California NaNOhio 35000Oregon 16000Texas 71000
在这种情况下, sdata 中的3个值被放在了合适的位置,但因为没有发现对应于 ‘California’ 的值,就出现了NaN (不是一个数),这在pandas中被用来标记数据缺失或NA 值。我使用“missing”或“NA”来表示数度丢失。
Series的字典也以嵌套的字典的字典格式的方式来处理:
In [62]: pdata = {‘Ohio‘: frame3[‘Ohio‘][:-1],
  ....: ‘Nevada‘: frame3[‘Nevada‘][:2]}

In [63]: DataFrame(pdata)
Out[63]:
     Nevada Ohio
2000    NaN  1.5
2001    2.4  1.7
series对象转换为字典dict
从series的字典构建中可以看出他们互相转换的机制了:将series对象的index作为keys,对应的值作为dict的value。
obj2 = pd.Series([4, 7, -5, 3], index=[‘d‘, ‘b‘, ‘a‘, ‘c‘])
d 4
b 7
a -5
c 3
dtype: int64
In[27]: dict(obj2)
{‘a‘: -5, ‘b‘: 7, ‘c‘: 3, ‘d‘: 4}
pandas中用函数isnull 和notnull 来检测数据丢失:
In [26]: pd.isnull(obj4) In [27]: pd.notnull(obj4)
Out[26]:                 Out[27]:
California True          California False
Ohio False               Ohio True
Oregon False             Oregon True
Texas False              Texas True
Series也提供了这些函数的实例方法:
In [28]: obj4.isnull()
Out[28]:
California True
Ohio False
Oregon False
Texas False
与正规的NumPy数组相比,你可以使用索引里的值来选择一个单一值或一个值集:
In [11]: obj2[‘a‘]
Out[11]: -5
In [12]: obj2[‘d‘] = 6
In [13]: obj2[[‘c‘, ‘a‘, ‘d‘]]
Out[13]:
c 3
a -5
d 6
NumPy数组操作,例如通过一个布尔数组过滤,纯量乘法,使用数学函数,将会保持索引和值间的关联:
In [14]: obj2
Out[14]:
d 6
b 7
a -5
c 3
In [15]: obj2[obj2 > 0]   In [16]: obj2 * 2       In [17]: np.exp(obj2)
Out[15]:                  Out[16]:                Out[17]:
d 6                       d 12                    d 403.428793
b 7                       b 14                    b 1096.633158
c 3                       a -10                   a 0.006738
                          c 6                     c 20.085537
In [29]: obj3        In [30]: obj4
Out[29]:             Out[30]:
Ohio 35000           California NaN
Oregon 16000         Ohio 35000
Texas 71000          Oregon 16000
Utah 5000            Texas 71000
In [31]: obj3 + obj4
Out[31]:
California NaN
Ohio 70000
Oregon 32000
Texas 142000
Utah NaN
Series对象本身和它的索引都有一个 name 属性,它和pandas的其它一些关键功能整合在一起:
In [32]: obj4.name = ‘population‘
In [33]: obj4.index.name = ‘state‘
In [34]: obj4
Out[34]:
state
California NaN
Ohio 35000
Oregon 16000
Texas 71000
Name: population
Series索引更改
可以通过赋值就地更改:
In [35]: obj.index = [‘Bob‘, ‘Steve‘, ‘Jeff‘, ‘Ryan‘]
In [36]: obj
Out[36]:
Bob 4
Steve 7
Jeff -5
Ryan 3
ser.replace(1, 11)
可以使用字典映射:将1替换为11,将2替换为12
ser.replace({1:11, 2:12})
series属性和方法参考[pandas.Series]
一个Datarame表示一个表格,类似电子表格的数据结构,包含一个经过排序的列表集,它们没一个都可以有不同的类型值(数字,字符串,布尔等等)。Datarame有行和列的索引;它可以被看作是一个Series的字典(每个Series共享一个索引)。与其它你以前使用过的(如R 的data.frame )类似Datarame的结构相比,在DataFrame里的面向行和面向列的操作大致是对称的。在底层,数据是作为一个或多个二维数组存储的,而不是列表,字典,或其它一维的数组集合。
| 二维ndarray | 一个数据矩阵,有可选的行标和列标 |
|---|---|
| 数组,列表或元组的字典 | 每一个序列成为DataFrame中的一列。所有的序列必须有相同的长度。 |
| NumPy的结构/记录数组 | 和“数组字典”一样处理 |
| Series的字典 | 每一个值成为一列。如果没有明显的传递索引,将结合每一个Series的索引来形成结果的行索引。 |
| 字典的字典 | 每一个内部的字典成为一列。和“Series的字典”一样,结合键值来形成行索引。 |
| 字典或Series的列表 | 每一项成为DataFrame中的一列。结合字典键或Series索引形成DataFrame的列标。 |
| 列表或元组的列表 | 和“二维ndarray”一样处理 |
| 另一个DataFrame | DataFrame的索引将被使用,除非传递另外一个 |
| NumPy伪装数组(MaskedArray) | 除了蒙蔽值在DataFrame中成为NA/丢失数据之外,其它的和“二维ndarray”一样 |
最常用的一个是用一个相等长度列表的字典或NumPy数组:
data = {‘state‘: [‘Ohio‘, ‘Ohio‘, ‘Ohio‘, ‘Nevada‘, ‘Nevada‘],
        ‘year‘: [2000, 2001, 2002, 2001, 2002],
        ‘pop‘: [1.5, 1.7, 3.6, 2.4, 2.9]}
frame = DataFrame(data)
由此产生的DataFrame和Series一样,它的索引会自动分配,并且对列进行了排序:
In [38]: frame
Out[38]:
  pop    state year
0 1.5     Ohio 2000
1 1.7     Ohio 2001
2 3.6     Ohio 2002
3 2.4   Nevada 2001
4 2.9   Nevada 2002
如果你设定了一个列的顺序,DataFrame的列将会精确的按照你所传递的顺序排列:
DataFrame(data, columns=[‘year‘, ‘state‘, ‘pop‘])
和Series一样,如果你传递了一个行,但不包括在 data 中,在结果中它会表示为NA值:
In [40]: frame2 = DataFrame(data, columns=[‘year‘, ‘state‘, ‘pop‘, ‘debt‘],
   ....: index=[‘one‘, ‘two‘, ‘three‘, ‘four‘, ‘five‘])
In [41]: frame2
Out[41]:
       year state   pop debt
one    2000 Ohio    1.5  NaN
two    2001 Ohio    1.7  NaN
three  2002 Ohio    3.6  NaN
four   2001 Nevada  2.4  NaN
five   2002 Nevada  2.9  NaN
Creating a DataFrame by passing a numpy array, with a datetime indexand labeled columns:
In [6]: dates = pd.date_range(‘20130101‘, periods=6)

In [7]: dates
Out[7]:
DatetimeIndex([‘2013-01-01‘, ‘2013-01-02‘, ‘2013-01-03‘, ‘2013-01-04‘,
               ‘2013-01-05‘, ‘2013-01-06‘],
              dtype=‘datetime64[ns]‘, freq=‘D‘)

In [8]: df = pd.DataFrame(np.random.randn(6,4), index=dates, columns=list(‘ABCD‘))

In [9]: df
Out[9]:
                   A         B         C         D
2013-01-01  0.469112 -0.282863 -1.509059 -1.135632
2013-01-02  1.212112 -0.173215  0.119209 -1.044236
2013-01-03 -0.861849 -2.104569 -0.494929  1.071804
2013-01-04  0.721555 -0.706771 -1.039575  0.271860
2013-01-05 -0.424972  0.567020  0.276232 -1.087401
2013-01-06 -0.673690  0.113648 -1.478427  0.524988
In [57]: pop = {‘Nevada‘: {2001: 2.4, 2002: 2.9},
   ....: ‘Ohio‘: {2000: 1.5, 2001: 1.7, 2002: 3.6}}
如果被传递到DataFrame,它的外部键会被解释为列索引,内部键会被解释为行索引:
In [58]: frame3 = DataFrame(pop)
In [59]: frame3
Out[59]:
     Nevada Ohio
2000    NaN  1.5
2001    2.4  1.7
2002    2.9  3.6
当然,你总是可以对结果转置:
In [60]: frame3.T
Out[60]:
2000 2001 2002
Nevada NaN 2.4 2.9
Ohio 1.5 1.7 3.6
内部字典的键被结合并排序来形成结果的索引。如果指定了一个特定的索引,就不是这样的了:
In [61]: DataFrame(pop, index=[2001, 2002, 2003])
Out[61]:
        Nevada Ohio
  2001     2.4  1.7
  2002     2.9  3.6
  2003     NaN  NaN
简单可知从字典构建dataframe就知道dataframe是如何转换为字典的了。如选择一列,就将series对象的index作为keys,对应的值作为dict的value。
data = {‘state‘: [‘Ohio‘, ‘Ohio‘, ‘Ohio‘, ‘Nevada‘, ‘Nevada‘], ‘year‘: [2000, 2001, 2002, 2001, 2002], ‘pop‘: [1.5, 1.7, 3.6, 2.4, 2.9]}
frame = pd.DataFrame(data, index = [2,3,4,5, 6])
pop state year
2 1.5 Ohio 2000
3 1.7 Ohio 2001
4 3.6 Ohio 2002
5 2.4 Nevada 2001
6 2.9 Nevada 2002
In[23]: dict(frame[‘year‘])
{2: 2000, 3: 2001, 4: 2002, 5: 2001, 6: 2002}
In[24]: dict(frame[[‘pop‘, ‘year‘]])
{‘pop‘: 2 1.5
3 1.7
4 3.6
5 2.4
6 2.9
Name: pop, dtype: float64,
‘year‘: 2 2000
3 2001
4 2002
5 2001
6 2002
Name: year, dtype: int64}
df.median()就是一个series对象
pd.DataFrame([df.median(), df.mean(), df.std()], index=[‘median‘, ‘mean‘, ‘std‘])
In [14]: df.head()
Out[14]:
                   A         B         C         D
2013-01-01  0.469112 -0.282863 -1.509059 -1.135632
2013-01-02  1.212112 -0.173215  0.119209 -1.044236
2013-01-03 -0.861849 -2.104569 -0.494929  1.071804
2013-01-04  0.721555 -0.706771 -1.039575  0.271860
2013-01-05 -0.424972  0.567020  0.276232 -1.087401

In [15]: df.tail(3)
Out[15]:
                   A         B         C         D
2013-01-04  0.721555 -0.706771 -1.039575  0.271860
2013-01-05 -0.424972  0.567020  0.276232 -1.087401
2013-01-06 -0.673690  0.113648 -1.478427  0.524988
Display the index, columns, and the underlying numpy data
pandas返回dataframe行数可能最快的方式:df.shape[0]
[how to get row count of pandas dataframe?]
Having specific dtypes
In [12]: df2.dtypes
Out[12]:
A           float64
B    datetime64[ns]
C           float32
D             int32
E          category
F            object
dtype: object
[Data Structure Intro section]
在R语言中,数据列和行的名字通过colnames和rownames来分别进行提取。在Python中,我们则使用columns和index属性来提取。
In [16]: df.index
Out[16]:
DatetimeIndex([‘2013-01-01‘, ‘2013-01-02‘, ‘2013-01-03‘, ‘2013-01-04‘,
               ‘2013-01-05‘, ‘2013-01-06‘],
              dtype=‘datetime64[ns]‘, freq=‘D‘)

In [17]: df.columns
Out[17]: Index([u‘A‘, u‘B‘, u‘C‘, u‘D‘], dtype=‘object‘)
像Series一样, values 属性返回一个包含在DataFrame中的数据的二维ndarray:
In [18]: df.values
Out[18]:
array([[ 0.4691, -0.2829, -1.5091, -1.1356],
       [ 1.2121, -0.1732,  0.1192, -1.0442],
       [-0.8618, -2.1046, -0.4949,  1.0718],
       [ 0.7216, -0.7068, -1.0396,  0.2719],
       [-0.425 ,  0.567 ,  0.2762, -1.0874],
       [-0.6737,  0.1136, -1.4784,  0.525 ]])
如果DataFrame各列的数据类型不同,则值数组的数据类型就会选用能兼容所有列的数据类型:
In [67]: frame2.values
Out[67]:
array([[2000, Ohio, 1.5, nan],
       [2001, Ohio, 1.7, -1.2],
       [2002, Ohio, 3.6, nan],
       [2001, Nevada, 2.4, -1.5],
       [2002, Nevada, 2.9, -1.7]], dtype=object)
如果一个DataFrame的 index 和 columns 有它们的 name ,也会被显示出来:
In [64]: frame3.index.name = ‘year‘; frame3.columns.name = ‘state‘
In [65]: frame3
Out[65]:
state Nevada Ohio
year
2000     NaN  1.5
2001     2.4  1.7
2002     2.9  3.6
使用 DataFrame.dtypes 可以查看每列的数据类型,Pandas默认可以读出int和float64,其它的都处理为object,需要转换格式的一般为日期时间。
DataFrame.astype() 方法可对整个DataFrame或某一列进行数据格式转换,支持Python和NumPy的数据类型。
df[‘Name‘] = df[‘Name‘].astype(np.datetime64)
rat_array = rat_mat_df.values
存在的坑:
l_array = df[‘VenueLocation‘].map(lambda s: np.array(s.split(‘,‘))).values
print(type(l_array))
print(l_array.shape)
<class ‘numpy.ndarray‘>
(483805,)而不是(483805, 2)
原因在于转换后array中的元素不是当成两列,而是一列,也就是将两个元素当成了一个列表或者array元素,只有一列了。进行数据转换时l_array.astype(float)就会出错:ValueError: setting an array element with a sequence。这里最好使用l_array = np.array([s.split(‘,‘) for s in l_array]).astype(float)。
和Series一样,在DataFrame中的一列可以通过字典记法或属性来检索,返回Series:
Note: 返回的Series包含和DataFrame相同的索引,并它们的 name 属性也被正确的设置了。
dataframe选择多列
lines = lines[[0, 1, 4]]或者
lines = lines[[‘user‘, ‘check-in_time‘, ‘location_id‘]]
>>> dates = pd.date_range(‘20130101‘, periods=6)
df = pd.DataFrame(np.random.randn(6,4), index=dates, columns=list(‘ABCD‘))
>>> dates
DatetimeIndex([‘2013-01-01‘, ‘2013-01-02‘, ‘2013-01-03‘, ‘2013-01-04‘,
‘2013-01-05‘, ‘2013-01-06‘],
dtype=‘datetime64[ns]‘, freq=‘D‘)
>>> df
A B C D
2013-01-01 2.036209 1.354010 -0.677409 -0.331978
2013-01-02 -1.403797 -1.094992 0.304359 -1.576272
2013-01-03 1.137673 0.636973 -0.746928 -0.606468
2013-01-04 0.833169 -2.575147 0.866364 1.337163
2013-01-05 2.081578 0.489227 -1.340284 -1.043864
2013-01-06 0.042469 -0.426114 -0.026990 0.636364
行可以直接通过[]选择,只是必须是数字范围或者字符串范围索引:
>>> df[‘2013-01-02‘:‘2013-01-03‘]
A B C D
2013-01-02 -1.403797 -1.094992 0.304359 -1.576272
2013-01-03 1.137673 0.636973 -0.746928 -0.606468
>>> df[3:5]
A B C D
2013-01-04 0.833169 -2.575147 0.866364 1.337163
2013-01-05 2.081578 0.489227 -1.340284 -1.043864
行也可以使用一些方法通过位置num或名字label来检索,例如 ix索引成员(field){更多ix使用实例可参考后面的“索引,挑选和过滤”部分}。
Note: 提取特定的某列数据。Python中,可以使用iloc或者ix属性,但是ix更稳定一些。
In [45]: frame2.ix[‘three‘]
Out[45]:
year   2002
state  Ohio
pop    3.6
debt   NaN
Name: three
df.ix[3]
Out[6]:
A -0.976627
B 0.766333
C -1.043501
D 0.554586
Name: 2013-01-04 00:00:00, dtype: float64
假设我们需数据第一列的前5行:
df.ix[1:3, [‘A‘, ‘B‘, ‘C‘]]2013-01-02 -1.403797 -1.094992 0.304359
2013-01-03 1.137673 0.636973 -0.746928
Select via the position of the passed integers
In [32]: df.iloc[3]
Out[32]:
A    0.721555
B   -0.706771
C   -1.039575
D    0.271860
Name: 2013-01-04 00:00:00, dtype: float64
By integer slices, acting similar to numpy/python
In [33]: df.iloc[3:5,0:2]
Out[33]:
                   A         B
2013-01-04  0.721555 -0.706771
2013-01-05 -0.424972  0.567020
By lists of integer position locations, similar to the numpy/python style
In [34]: df.iloc[[1,2,4],[0,2]]
Out[34]:
                   A         C
2013-01-02  1.212112  0.119209
2013-01-03 -0.861849 -0.494929
2013-01-05 -0.424972  0.276232
For getting fast access to a scalar (equiv to the prior method)
In [38]: df.iat[1,1]
Out[38]: -0.17321464905330858In [26]: df.loc[dates[0]]
Out[26]:
A 0.469112
B -0.282863
C -1.509059
D -1.135632
Name: 2013-01-01 00:00:00, dtype: float64
Selecting on a multi-axis by label
In [27]: df.loc[:,[‘A‘,‘B‘]]
Out[27]:
                   A         B
2013-01-01  0.469112 -0.282863
2013-01-02  1.212112 -0.173215
2013-01-03 -0.861849 -2.104569
2013-01-04  0.721555 -0.706771
2013-01-05 -0.424972  0.567020
2013-01-06 -0.673690 0.113648For getting fast access to a scalar (equiv to the prior method)
In [31]: df.at[dates[0],‘A‘]
Out[31]: 0.46911229990718628Using a single column’s values to select data.
In [39]: df[df.A > 0]
Out[39]:
                   A         B         C         D
2013-01-01  0.469112 -0.282863 -1.509059 -1.135632
2013-01-02  1.212112 -0.173215  0.119209 -1.044236
2013-01-04  0.721555 -0.706771 -1.039575  0.271860
A where operation for getting.
In [40]: df[df > 0]
Out[40]:
                   A         B         C         D
2013-01-01  0.469112       NaN       NaN       NaN
...Using the isin() method for filtering:
In [41]: df2 = df.copy()

In [42]: df2[‘E‘] = [‘one‘, ‘one‘,‘two‘,‘three‘,‘four‘,‘three‘]

In [43]: df2
Out[43]:
                   A         B         C         D      E
2013-01-01  0.469112 -0.282863 -1.509059 -1.135632    one
2013-01-02  1.212112 -0.173215  0.119209 -1.044236    one
2013-01-03 -0.861849 -2.104569 -0.494929  1.071804    two
2013-01-04  0.721555 -0.706771 -1.039575  0.271860  three
2013-01-05 -0.424972  0.567020  0.276232 -1.087401   four
2013-01-06 -0.673690  0.113648 -1.478427  0.524988  three

In [44]: df2[df2[‘E‘].isin([‘two‘,‘four‘])]
Out[44]:
                   A         B         C         D     E
2013-01-03 -0.861849 -2.104569 -0.494929  1.071804   two
2013-01-05 -0.424972 0.567020 0.276232 -1.087401 four修改方法有:
df[‘F‘] = s1
df.at[dates[0],‘A‘] = 0
df.iat[0,1] = 0
df.loc[:,‘D‘] = np.array([5] * len(df))
列可以通过赋值来修改。例如,空的 ‘debt’ 列可以通过一个纯量或数组来赋值:
In [46]: frame2[‘debt‘] = 16.5
In [47]: frame2
Out[47]:
      year state  pop debt
one   2000 Ohio   1.5 16.5
two   2001 Ohio   1.7 16.5
three 2002 Ohio   3.6 16.5
four  2001 Nevada 2.4 16.5
five  2002 Nevada 2.9 16.5
In [48]: frame2[‘debt‘] = np.arange(5.)
In [49]: frame2
Out[49]:
      year state  pop debt
one   2000 Ohio   1.5 0
two   2001 Ohio   1.7 1
three 2002 Ohio   3.6 2
four  2001 Nevada 2.4 3
five  2002 Nevada 2.9 4
#没有第6列,增加第6列
df[6] = np.select([y_score < 0.0, y_score > 1.0, True], [0.0, 1.0, y_score])
通过列表或数组给一列赋值时,所赋的值的长度必须和DataFrame的长度相匹配。
如果你使用Series来赋值,它会代替在DataFrame中精确匹配的索引的值,并在说有的空洞插入丢失数据:
In [50]: val = Series([-1.2, -1.5, -1.7], index=[‘two‘, ‘four‘, ‘five‘])
In [51]: frame2[‘debt‘] = val
In [52]: frame2
Out[52]:
      year state  pop  debt
one   2000 Ohio   1.5  NaN
two   2001 Ohio   1.7  -1.2
three 2002 Ohio   3.6  NaN
four  2001 Nevada 2.4  -1.5
five  2002 Nevada 2.9  -1.7
给一个不存在的列赋值,将会创建一个新的列。
In [53]: frame2[‘eastern‘] = frame2.state == ‘Ohio‘
In [54]: frame2
Out[54]:
      year  state pop   debt eastern
one   2000   Ohio 1.5    NaN    True
two   2001   Ohio 1.7   -1.2    True
three 2002   Ohio 3.6    NaN    True
four  2001 Nevada 2.4   -1.5   False
five  2002 Nevada 2.9   -1.7   False
In [55]: del frame2[‘eastern‘]
In [56]: frame2.columns
Out[56]: Index([year, state, pop, debt], dtype=object)
ltu_df = ltu_df.join(ltu_df[‘VenueLocation‘].apply(lambda s: pd.Series([float(i) for i in s.split(‘,‘)])))[pandas: How do I split text in a column into multiple rows?]
或者
df = pd.concat([df, dates.apply(lambda x: pd.Series(json.loads(x)))], axis=1, ignore_index=True)或者
lista = [item.split(‘ ‘)[2] for item in df[‘Fecha‘]]
listb = p.Series([item.split(‘ ‘)[0] for item in df[‘Fecha‘]])
df[‘Fecha‘].update(listb)
df[‘Hora‘] = listadf.loc[df[len(df.columns) - 1] > 0.0, len(df.columns) - 1] = 1.0不建议设置不提示:pd.options.mode.chained_assignment = None # default=‘warn‘
通过.ix选择的数据是一个copy的数据,修改这个选择不会修改原数据,而.loc是修改原数据。
The .ix object tries to do more than one thing, and for anyone who has read anything about clean code, this is a strong smell.
Given this dataframe:
df = pd.DataFrame({"a": [1,2,3,4], "b": [1,1,2,2]})Two behaviors:
dfcopy = df.ix[:,["a"]]
dfcopy.a.ix[0] = 2
Behavior one: dfcopy is now a stand alone dataframe. Changing it will not change df
df.ix[0, "a"] = 3
Behavior two: This changes the original dataframe.
Use .loc instead
The pandas developers recognized that the .ix object was quite smelly[speculatively] and thus created two new objects which helps in the accession and assignment of data.
.loc is faster, because it does not try to create a copy of the data.
.loc is meant to modify your existing dataframe inplace, which is more memory efficient.
.loc is predictable, it has one behavior.
[Indexing and Selecing Data][MultiIndex / Advanced Indexing]
DataFrame.replace(to_replace=None, value=None, inplace=False, limit=None, regex=False, method=‘pad‘, axis=None)
参数to_replace : str, regex, list, dict, Series, numeric, or None
dict: Nested dictionaries, e.g., {‘a’: {‘b’: nan}}, are read asfollows: look in column ‘a’ for the value ‘b’ and replace itwith nan. You can nest regular expressions as well. Note thatcolumn names (the top-level dictionary keys in a nesteddictionary) cannot be regular expressions.
Keys map to column names and values map to substitutionvalues. You can treat this as a special case of passing twolists except that you are specifying the column to search in.
ui_rec_df.replace({0: item_names_dict}, inplace=True)
不过字典的方法只能一列一列的将某个值替换为另一个值。所以还可以这样:
for key in item_names_dict:
    ui_rec_df.replace(key, item_names_dict[key], inplace=True)
要替换的值还可以是正则表达式regex : bool or same types as to_replace, default False
pandas的索引对象用来保存坐标轴标签和其它元数据(如坐标轴名或名称)。构建一个Series或DataFrame时任何数组或其它序列标签在内部转化为索引:
In [68]: obj = Series(range(3), index=[‘a‘, ‘b‘, ‘c‘])
In [69]: index = obj.index
In [70]: index
Out[70]: Index([a, b, c], dtype=object)
In [71]: index[1:]
Out[71]: Index([b, c], dtype=object)
索引对象是不可变的,因此不能由用户改变:
In [72]: index[1] = ‘d‘
Exception Traceback (most recent call last)...
Exception: <class ‘pandas.core.index.Index‘> object is immutable
索引对象的不可变性非常重要,这样它可以在数据结构中结构中安全的共享:
In [73]: index = pd.Index(np.arange(3))
In [74]: obj2 = Series([1.5, -2.5, 0], index=index)
In [75]: obj2.index is index
Out[75]: True
表格 是库中内建的索引类清单。通过一些开发努力,索引可以被子类化,来实现特定坐标轴索引功能。多数用户不必要知道许多索引对象的知识,但是它们仍然是pandas数据模型的重要部分。
| Index | 最通用的索引对象,使用Python对象的NumPy数组来表示坐标轴标签。 |
|---|---|
| Int64Index | 对整形值的特化索引。 |
| MultiIndex | “分层”索引对象,表示单个轴的多层次的索引。可以被认为是类似的元组的数组。 |
| DatetimeIndex | 存储纳秒时间戳(使用NumPy的datetime64 dtyppe来表示)。 |
| PeriodIndex | 对周期数据(时间间隔的)的特化索引。 |
除了类似于阵列,索引也有类似固定大小集合一样的功能
In [76]: frame3
Out[76]:
state Nevada Ohio
year
2000     NaN  1.5
2001     2.4  1.7
2002     2.9  3.6

In [77]: ‘Ohio‘ in frame3.columns
Out[77]: True
In [78]: 2003 in frame3.index
Out[78]: False
每个索引都有许多关于集合逻辑的方法和属性,且能够解决它所包含的数据的常见问题。
| append | 链接额外的索引对象,产生一个新的索引 |
|---|---|
| diff | 计算索引的差集 |
| intersection | 计算交集 |
| union | 计算并集 |
| isin | 计算出一个布尔数组表示每一个值是否包含在所传递的集合里 |
| delete | 计算删除位置i的元素的索引 |
| drop | 计算删除所传递的值后的索引 |
| insert | 计算在位置i插入元素后的索引 |
| is_monotonic | 返回True,如果每一个元素都比它前面的元素大或相等 |
| is_unique | 返回True,如果索引没有重复的值 |
| unique | 计算索引的唯一值数组 |
本节将带你穿过Series或DataFrame所包含的数据的基础结构的相互关系。
Series索引( obj[...] )的工作原理类似与NumPy索引,除了可以使用Series的索引值,也可以仅使用整数索引。
In [102]: obj = Series(np.arange(4.), index=[‘a‘, ‘b‘, ‘c‘, ‘d‘])
In [103]: obj[‘b‘]     In [104]: obj[1]
Out[103]: 1.0          Out[104]: 1.0
In [105]: obj[2:4]     In [106]: obj[[‘b‘, ‘a‘, ‘d‘]]
Out[105]:              Out[106]:
c   2                  b    1
d   3                  a    0
d   3

In [107]: obj[[1, 3]]      In [108]: obj[obj < 2]
Out[107]:                  Out[108]:
b   1                      a    0
d   3                      b    1
整数索引
操作由整数索引的pandas对象跟内置的Python数据结构 (如列表和元组)在索引语义上有些不同。
例如,你可能认为下面这段代码不会产生一个错误:
ser = pd.Series(np.arange(3.))
ser
Out[11]:
0 0.0
1 1.0
2 2.0
dtype: float64
ser[-1]
这里,有一个含有0,1,2的索引,很难推断出用户想要什么(基于标签或位置的索引);相反,一个非整数索引,就没有这样的歧义:
>>>ser2 = pd.Series(np.arange(3.), index=[‘a‘, ‘b‘, ‘c‘])
>>>ser2[-1]
2.0
为了保持良好的一致性,如果轴索引含有索引器,那么根据整数进行数据选取的操作将总是面向标签的。这也包括用ix进行切片:
ser.ix[:1]
Out[15]:
0 0.0
1 1.0
dtype: float64
如果你需要可靠的、不考虑索引类型的、基于位置的索引,可以使用Series的iget_ value 方法和 DataFrame 的 irow 和 icol 方法:
>>> ser3 = pd.Series(range(3), index=[-5, 1, 3])
>>> ser3.iget_value(2)
2
>>> frame = pd.DataFrame(np.arange(6).reshape(3, 2), index=[2,0,1])
frame
Out[21]:
0 1
2 0 1
0 2 3
1 4 5
>>> frame.irow(0)
0 0
1 1
Name: 2, dtype: int32
使用标签来切片和正常的Python切片并不一样,它会把结束点也包括在内:
In [109]: obj[‘b‘:‘c‘]
Out[109]:
b   1
c   2
使用这些函数来赋值
In [110]: obj[‘b‘:‘c‘] = 5
In [111]: obj
Out[111]:
a   0
b   5
c   5
d   3
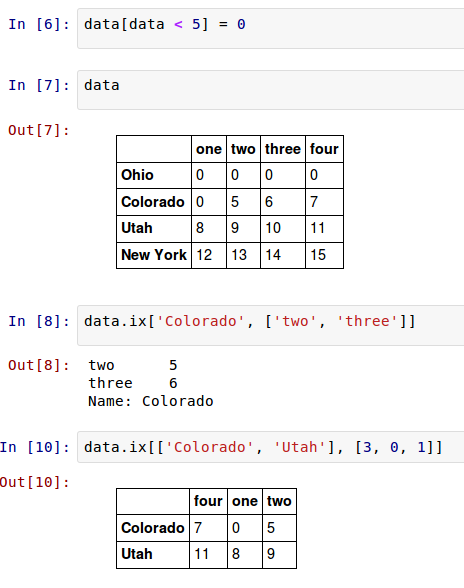
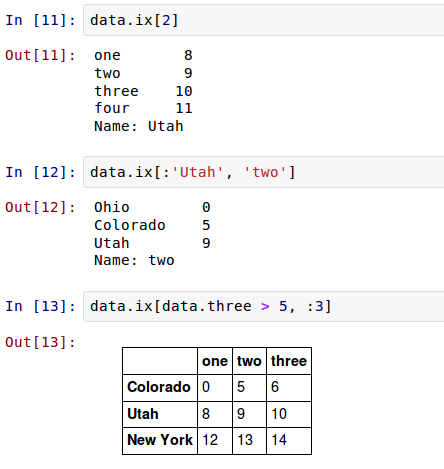
通过切片或一个布尔数组来选择行,这旨在在这种情况下使得DataFrame的语法更像一个ndarry。
In [116]: data[:2]             In [117]: data[data[‘three‘] > 5]
Out[116]:                      Out[117]:
         one two three four             one two three four
Ohio       0   1     2    3    Colorado   4   5     6    7
Colorado   4   5     6    7    Utah       8   9    10   11
                               New York  12  13    14   15
DataFrame可以在行上进行标签索引,使你可以从DataFrame选择一个行和列的子集,使用像NumPy的记法再加上轴标签。这也是一种不是很冗长的重新索引的方法:
因此,有很多方法来选择和重排包含在pandas对象中的数据。
还有分层索引及一些额外的选项。
| obj[val] | 从DataFrame选择单一列或连续列。特殊情况下的便利:布尔数组(过滤行),切片(行切片),或布尔DataFrame(根据一些标准来设置值)。 |
|---|---|
| obj.ix[val] | 从DataFrame的行集选择单行 |
| obj.ix[:, val] | 从列集选择单列 |
| obj.ix[val1, val2] | 选择行和列 |
| reindex 方法 | 转换一个或多个轴到新的索引 |
| xs 方法 | 通过标签选择单行或单列到一个Series |
| icol, irow 方法 | 通过整数位置,分别的选择单行或单列到一个Series |
| get_value, set_value 方法 | 通过行和列标选择一个单值 |
Note:在设计pandas时,我觉得不得不敲下 frame[:, col] 来选择一列,是非常冗余的(且易出错的),因此列选择是最常见的操作之一。因此,我做了这个设计权衡,把所有的富标签索引引入到ix 。
pandas对象的一个关键的方法是 reindex ,意味着使数据符合一个新的索引来构造一个新的对象。
| index | 作为索引的新序列。可以是索引实例或任何类似序列的Python数据结构。一个索引被完全使用,没有任何拷贝。 |
|---|---|
| method | 插值(填充)方法,见表格5-4的选项 |
| fill_value | 代替重新索引时引入的缺失数据值 |
| limit | 当前向或后向填充时,最大的填充间隙 |
| level | 在多层索引上匹配简单索引,否则选择一个子集 |
| copy | 如果新索引与就的相等则底层数据不会拷贝。默认为True(即始终拷贝) |
In [79]: obj = Series([4.5, 7.2, -5.3, 3.6], index=[‘d‘, ‘b‘, ‘a‘, ‘c‘])
In [80]: obj
Out[80]:
d  4.5
b  7.2
a -5.3
c  3.6
在Series上调用 reindex 重排数据,使得它符合新的索引,如果那个索引的值不存在就引入缺失数据值:
In [81]: obj2 = obj.reindex([‘a‘, ‘b‘, ‘c‘, ‘d‘, ‘e‘])
In [82]: obj2
Out[82]:
a -5.3
b 7.2
c 3.6
d 4.5
e NaN
In [83]: obj.reindex([‘a‘, ‘b‘, ‘c‘, ‘d‘, ‘e‘], fill_value=0)
Out[83]:
a -5.3
b 7.2
c 3.6
d 4.5
e 0.0
为了对时间序列这样的数据排序,当重建索引的时候可能想要对值进行内插或填充。 method 选项可以是你做到这一点,使用一个如ffill 的方法来向前填充值:
In [84]: obj3 = Series([‘blue‘, ‘purple‘, ‘yellow‘], index=[0, 2, 4])
In [85]: obj3.reindex(range(6), method=‘ffill‘)
Out[85]:
0   blue
1   blue
2 purple
3 purple
4 yellow
5 yellow
method 选项的清单
| 参数 | 描述 |
|---|---|
| ffill或pad | 前向(或进位)填充 |
| bfill或backfill | 后向(或进位)填充 |
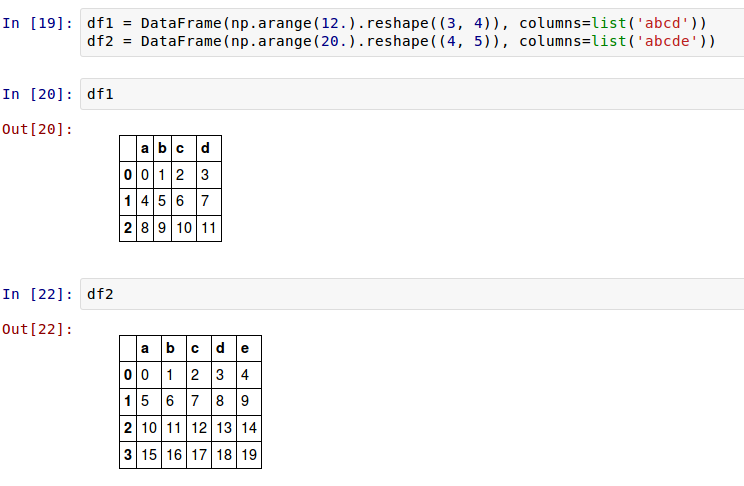
对于DataFrame, reindex 可以改变(行)索引,列或两者。当只传入一个序列时,结果中的行被重新索引了:
In [86]: frame = DataFrame(np.arange(9).reshape((3, 3)), index=[‘a‘, ‘c‘, ‘d‘], columns=[‘Ohio‘, ‘Texas‘, ‘California‘])
In [87]: frame
Out[87]:
  Ohio Texas California
a    0     1          2
c    3     4          5
d    6     7          8
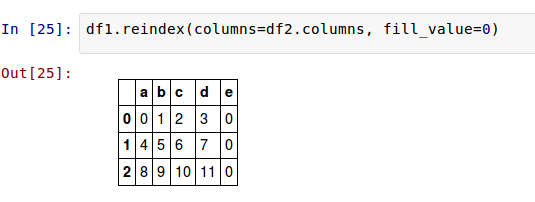
使用 columns 关键字可以是列重新索引:
In [90]: states = [‘Texas‘, ‘Utah‘, ‘California‘]
In [91]: frame.reindex(columns=states)
Out[91]:
   Texas Utah California
a      1  NaN          2
c      4  NaN          5
d      7  NaN          8
DataFrame重命名列columns方法2:
df.rename(columns={‘age‘: ‘x‘, ‘fat_percent‘: ‘y‘})一次可以对两个重新索引,可是插值只在行侧(0坐标轴)进行:
In [92]: frame.reindex(index=[‘a‘, ‘b‘, ‘c‘, ‘d‘], method=‘ffill‘, columns=states)
Out[92]:
   Texas Utah California
a      1  NaN          2
b      1  NaN          2
c      4  NaN          5
d      7  NaN          8
正如你将看到的,使用带标签索引的 ix 可以把重新索引做的更简单:
In [93]: frame.ix[[‘a‘, ‘b‘, ‘c‘, ‘d‘], states]
Out[93]:
  Texas Utah California
a     1  NaN          2
b   NaN  NaN        NaN
c     4  NaN          5
d     7  NaN          8
丢弃某条轴上的一个或多个项很简单,只要有一个索引数组或列表即可。由于需要执行一些数据整理和集合逻辑,所以drop方法返回的是一个在指定轴上删除了指定值的新对象:
In [94]: obj = Series(np.arange(5.), index=[‘a‘, ‘b‘, ‘c‘, ‘d‘, ‘e‘])
In [95]: new_obj = obj.drop(‘c‘)
In [97]: obj.drop([‘d‘, ‘c‘])
Out[97]:
a   0
b   1
e   4
可以从任何坐标轴删除索引值:axis 参数告诉函数到底舍弃列还是行,如果axis等于0,那么就舍弃行。
In [98]: data = DataFrame(np.arange(16).reshape((4, 4)), index=[‘Ohio‘, ‘Colorado‘, ‘Utah‘, ‘New York‘], columns=[‘one‘, ‘two‘, ‘three‘, ‘four‘])
In [99]: data.drop([‘Colorado‘, ‘Ohio‘])
Out[99]:
         one two three four
Utah       8   9    10   11
New York  12  13    14   15
测试了一下,也可以使用df.drop(1)来删除行1。

In [100]: data.drop(‘two‘, axis=1)      In [101]: data.drop([‘two‘, ‘four‘], axis=1) #等价于date.drop(date.columns[[1, 3]], axis = 1)
Out[100]: Out[101]:
       one   three four                            one three
Ohio     0   2        3                 Ohio         0     2
Colorado 4   6        7                 Colorado     4     6
Utah     8   10      11                 Utah         8    10
New York 12 14 15 New York 12 14pandas的最重要的特性之一是在具有不同索引的对象间进行算术运算的行为。当把对象加起来时,如果有任何的索引对不相同的话,在结果中将会把各自的索引联合起来。
对于Series
>>>s1 = Series([7.3, -2.5, 3.4, 1.5],index=[‘a‘, ‘c‘, ‘d‘, ‘e‘])
>>>s2 = Series([-2.1, 3.6, -1.5, 4, 3.1], index=[‘a‘, ‘c‘, ‘e‘, ‘f‘, ‘g‘])
内部数据对其,在索引不重合的地方引入了NA值。数据缺失在算术运算中会传播。
对于DataFrame
对其在行和列上都表现的很好:
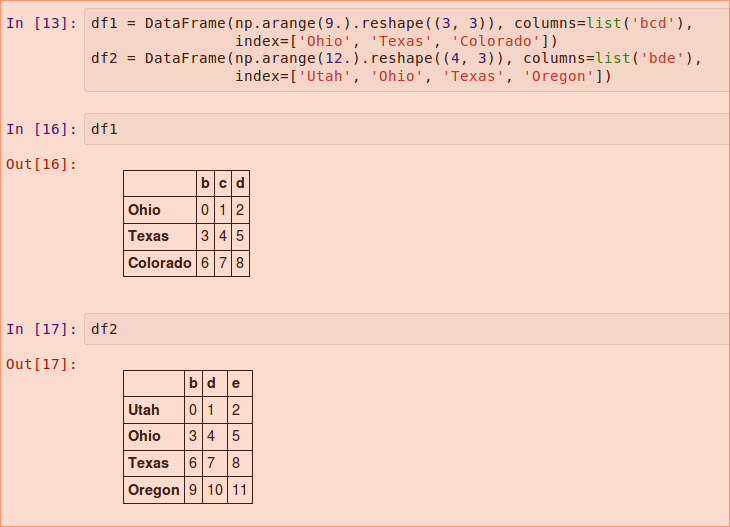
把这些加起来返回一个DataFrame,它的索引和列是每一个DataFrame对应的索引和列的联合:
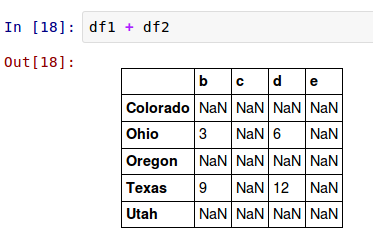
在不同索引对象间的算术运算,当一个轴标签在另一个对象中找不到时,你可能想要填充一个特定的值,如0:
把它们加起来导致在不重合的位置出现NA值。
在 df1 上使用 add 方法,我把 df2 传递给它并给fill_value 赋了一个参数:
>>>df1.add(df2, fill_value=0)
与此类似,在对Series或DataFrame重新索引时,也可以指定一个填充值:
| add | 加法(+) |
|---|---|
| sub | 减法(-) |
| div | 除法(/) |
| mul | 乘法(*) |
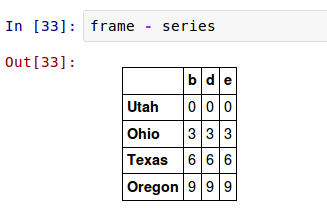
与NumPy数组一样,很好的定义了DataFrame和Series间的算术操作。
首先,作为一个激发性的例子,考虑一个二维数组和它的一个行间的差分,这被称为 广播 (broadcasting)。
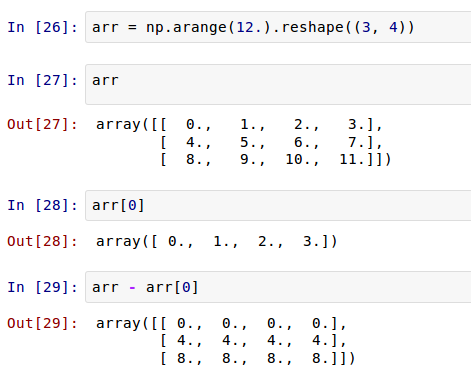
在一个DataFrame和一个Series间的操作是类似的:
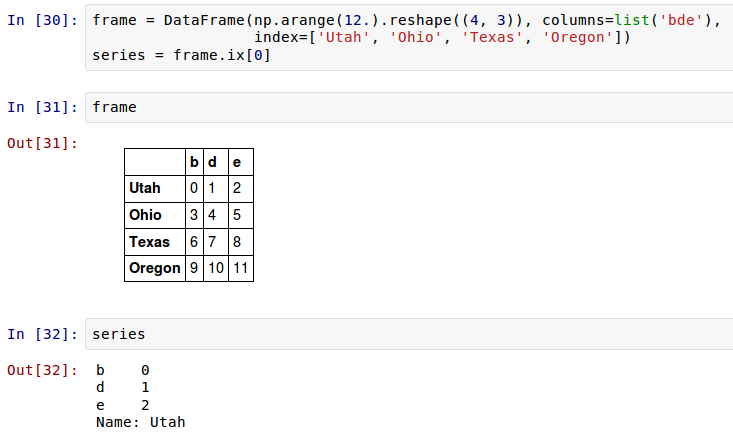
默认的,DataFrame和Series间的算术运算Series的索引将匹配DataFrame的列,并在行上扩展:
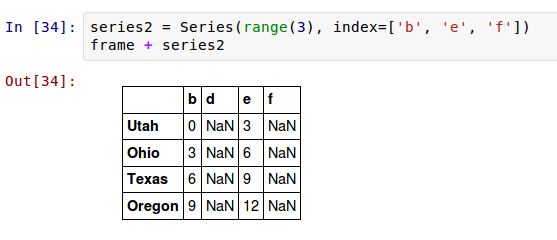
如果一个索引值在DataFrame的列和Series的索引里都找不着,对象将会从它们的联合重建索引:
如果想在行上而不是列上进行扩展,你要使用一个算术方法。例如:
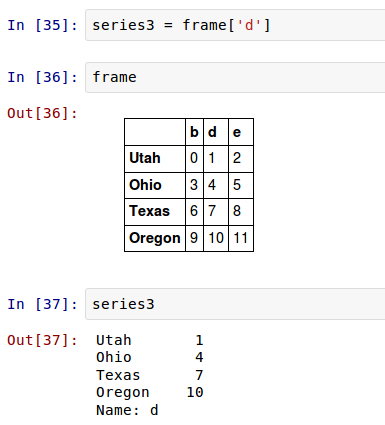
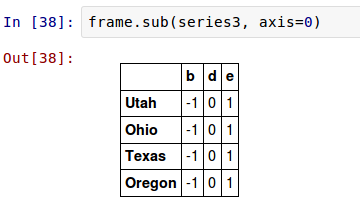
你所传递的坐标值是将要匹配的 坐标 。这种情况下是匹配DataFrame的行,并进行扩展。
np.abs(frame)
DataFrame的 apply方法即可实现此功能。许多最为常见的数组统计功能都被实现成DataFrame的方法(如sum和mean),因此无需使用apply方法。
默认对列操作(axis=0),如传入np.sum()是对每列求和。
返回标量值
>>>f = lambda x: x.max() - x.min()
>>>frame.apply(f)
>>>frame.apply(f, axis=1)
df.apply(np.cumsum)
除标量值外,传递给apply的函数还可以返回由多个值组成的Series
>>>def f(x):
return Series([x.min(), x.max()], index=[‘min‘, ‘max‘])
>>>frame.apply(f)
假如想得到frame中各个浮点值的格式化字符串,使用applymap即可。
>>>format = lambda x: ‘%.2f‘ % x
>>>frame.applymap(format)
之所以叫做applymap,是因为Series有一个用于应用元素级函数的map方法:
>>>frame[‘e‘].map(format)
根据条件对数据集排序(sorting)也是一种重要的内置运算。
sort_index方法,它将返回一个已排序的新对象:
>>>obj = Series(range(4), index=[‘d‘, ‘a‘, ‘b‘, ‘c‘])
>>>obj.sort_index()
a 1
b 2
c 3
d 0
dtype: int64
>>>obj = Series([4, 7, -3, 2])
>>>obj.order()
2 -3
3 2
0 4
1 7
>>>obj = Series([4, np.nan, 1, np.nan, -3, 2])
>>>obj.order() #在排序时,缺失值默认都会被放到Series的末尾.
4 -3
2 1
5 2
0 4
1 NaN
NaN
>>>frame = DataFrame(np.arange(8).reshape((2, 4)), index=[‘three‘, ‘one‘], columns=[‘d‘,‘a‘,‘b‘,‘c‘])
>>>frame.sort_index()
>>>frame.sort_index(axis=1)
数据默认是按升序排序的,但也可以降序排序:
>>>frame.sort_index(axis=1, ascending=False)
将一个或多个列的名字传递给by选项即可达到该目的:
>>>frame = DataFrame({‘b‘: [4,7,-3,2], ‘a‘:[0, 1, 0, 1]})
>>> frame.sort_index(by=‘b‘) #或者df.sort_values(by=‘b‘)
要根据多个列进行排序,传入名称的列表即可:>>>frame.sort_index(by=[‘a‘, ‘b‘])
或者syntax of sort:
DataFrame.sort(columns=None, axis=0, ascending=True, inplace=False, kind=‘quicksort‘,na_position=‘last‘)
we will sort the data by “2013” column
Insurance_rates.sort([‘2013‘,‘State‘],ascending=[1, 0])
跟排序关系密切,且它会增设一个排名值(从1开始,一直到数组中有 效数据的数量)。
它跟numpy.argsort产生的间接排序索引差不多,只不过它可以根据某种规则破坏平级关系。
Series和DataFrame的rank方法:默认情况下,rank是通过“为各组分配一个平均排名”的方式破坏平级关系的:
>>> obj = Series([7,-5,7,4,2,0,4])
>>>obj
0 7
1 -5
2 7
3 4
4 2
5 0
6 4
>>> print obj.rank()
0 6.5
1 1.0
2 6.5
3 4.5
4 3.0
5 2.0
6 4.5
>>> obj.rank(method=‘first‘) #根据值在原数据中出现的顺序给出排名:
0 6
1 1
2 7
3 4
4 3
5 2
5
>>> obj.rank(ascending=False, method=‘max‘) # 按降序进行排名:
0 2
1 7
2 2
3 4
4 5
5 6
6 4
Method 说明
‘average’ 默认:在相等分组中,为各个值分配平均排名
‘min’ 使用整个分组的最小排名
‘max’ 使用整个分组的最大排名
‘first’ 按值在原始数据中的出现顺序分配排名
>>> frame =DataFrame({‘b‘: [4.3, 7, -3, 2], ‘a‘: [0, 1, 0, 1],
‘c‘:[-2, 5, 8, -2.5]})
>>> frame.rank(axis=1)
>>>obj = Series(range(5), index=[‘a‘,‘a‘,‘b‘,‘b‘,‘c‘])
>>>obj
a 0
a 1
b 2
b 3
c 4
验证是否是唯一的
>>>obj.index.is_unique
False
如果某个索引对应多个值,则 返回一个Series;而对应单个值的,则返回一个标量值。
>>>obj[‘a‘]
a 0
a 1
>>>obj[‘c‘]
4
对DataFrame的行进行索引时也是如此:
>>> df = DataFrame(np.random.randn(4, 3), index=[‘a‘,‘a‘,‘b‘,‘b‘])
>>>df
>>> df.ix[‘b‘]
ref:《利用Python进行数据分析》*
官网pandas: Python Data Analysis Library: API Reference* 10 Minutes to pandas*十分钟搞定pandas pandas 0.18.1 documentation Essential Basic Functionality
pandas-cookbook
Python For Data Analysis*pandas入门 Errata for Python for Data Analysis
14 BEST PYTHON PANDAS FEATURES
[Python数据处理:Pandas模块的 12 种实用技巧]
[Pandas 中的坑:index操作 遍历操作]
标签:数据集 intersect 数据分析 lines time 获取 font join point
原文地址:http://blog.csdn.net/pipisorry/article/details/18010307