标签:atl pre using original frequency 示例 label png end


代码:
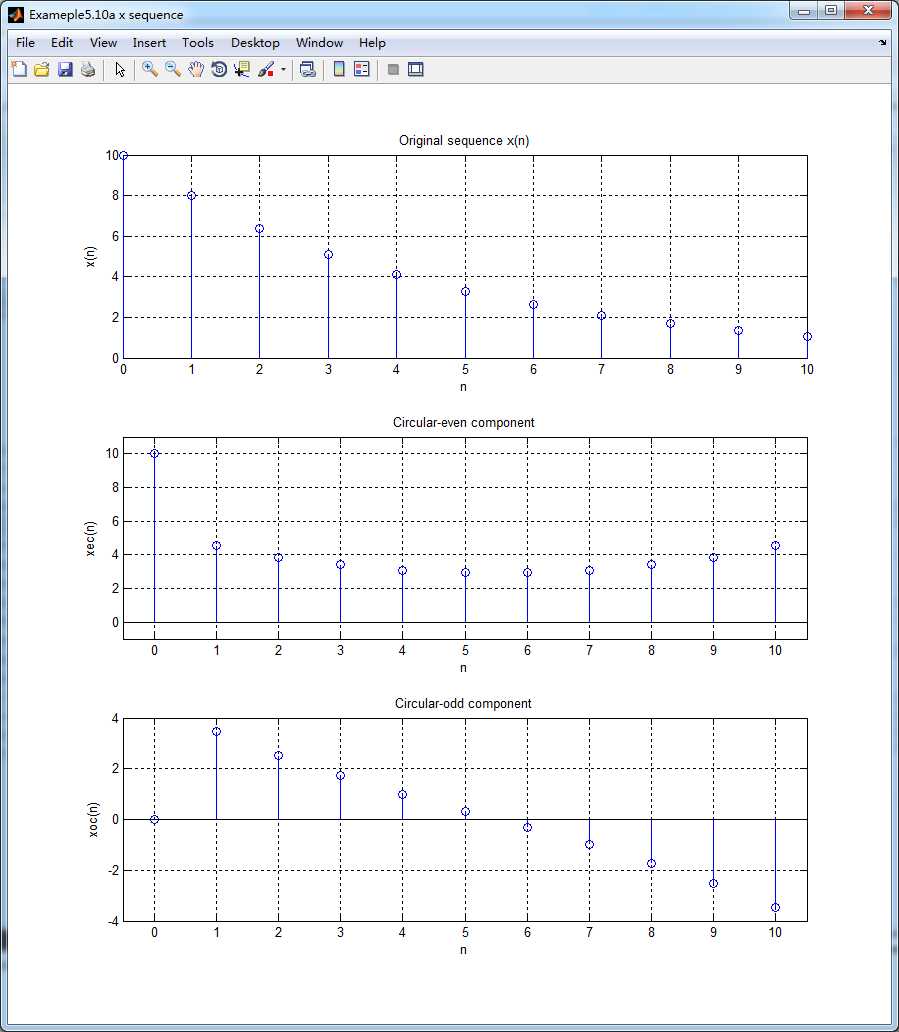
n = 0:10; x = 10*(0.8) .^ n;
[xec, xoc] = circevod(x);
%% -----------------------------------------------------------------
%%                  START   a
%% -----------------------------------------------------------------
figure(‘NumberTitle‘, ‘off‘, ‘Name‘, ‘Exameple5.10a x sequence‘)
set(gcf,‘Color‘,‘white‘);
subplot(3,1,1); stem(n,x); title(‘Original sequence x(n)‘); %axis([0,10,-2.5,2.5]);
xlabel(‘n‘); ylabel(‘x(n)‘); grid on;
subplot(3,1,2); stem(n,xec); title(‘Circular-even component‘); axis([-0.5,10.5,-1,11]);
xlabel(‘n‘); ylabel(‘xec(n)‘); grid on;
subplot(3,1,3); stem(n,xoc); title(‘Circular-odd component‘); axis([-0.5,10.5,-4,4]);
xlabel(‘n‘); ylabel(‘xoc(n)‘); grid on;

%% -----------------------------------------------------------------
%%                  END   a
%% -----------------------------------------------------------------


%% -----------------------------------------------------------------
%%              START   b
%% -----------------------------------------------------------------
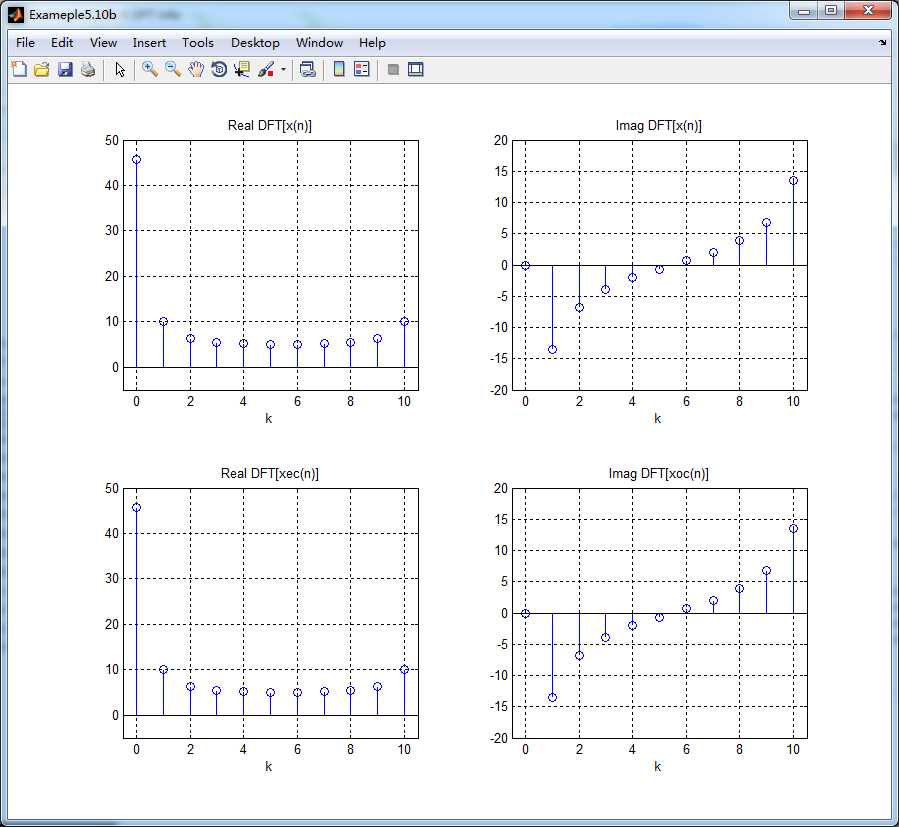
X_DFT = dft(x,11);                                       % DFT of x
Xec_DFT = dft(xec,11); Xoc_DFT = dft(xoc,11);            % DFT of xec and xoc

realX_DFT = real(X_DFT); imagX_DFT = imag(X_DFT); magX_DFT = abs(X_DFT(1:1:6)); phaX_DFT = angle(X_DFT(1:1:6))*180/pi;
realXec_DFT = real(Xec_DFT); imagXec_DFT = imag(Xec_DFT); magXec_DFT = abs(Xec_DFT(1:1:6)); phaXec_DFT = angle(Xec_DFT)*180/pi;
realXoc_DFT = real(Xoc_DFT); imagXoc_DFT = imag(Xoc_DFT); magXoc_DFT = abs(Xoc_DFT(1:1:6)); phaXoc_DFT = angle(Xoc_DFT)*180/pi;

figure(‘NumberTitle‘, ‘off‘, ‘Name‘, ‘Exameple5.10b ‘)
set(gcf,‘Color‘,‘white‘);
subplot(2,2,1); stem(n,realX_DFT); title(‘Real {DFT[x(n)]}‘); axis([-0.5,10.5,-5,50]);
xlabel(‘k‘); grid on;
subplot(2,2,2); stem(n,imagX_DFT); title(‘Imag {DFT[x(n)]}‘); axis([-0.5,10.5,-20,20]);
xlabel(‘k‘); grid on;
subplot(2,2,3); stem(n,realXec_DFT); title(‘Real {DFT[xec(n)]}‘); axis([-0.5,10.5,-5,50]);
xlabel(‘k‘); grid on;
subplot(2,2,4); stem(n,imagXoc_DFT); title(‘Imag {DFT[xoc(n)]}‘); axis([-0.5,10.5,-20,20]);
xlabel(‘k‘); grid on;

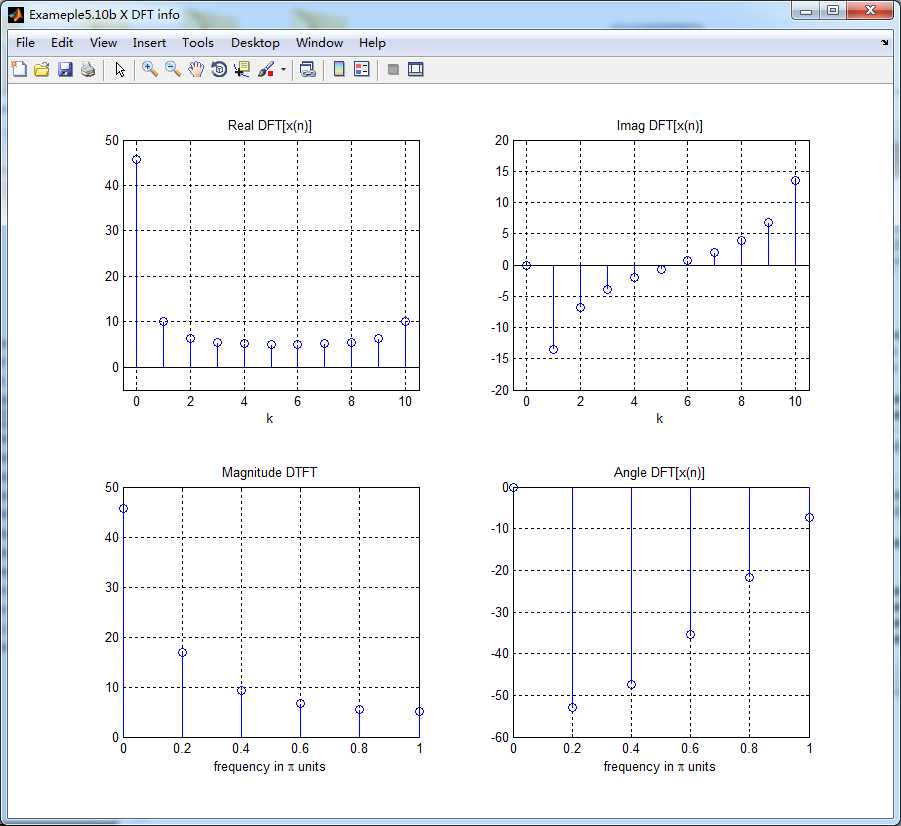
figure(‘NumberTitle‘, ‘off‘, ‘Name‘, ‘Exameple5.10b X DFT info‘)
set(gcf,‘Color‘,‘white‘);
subplot(2,2,1); stem(n,realX_DFT); title(‘Real {DFT[x(n)]}‘); axis([-0.5,10.5,-5,50]);
xlabel(‘k‘); grid on;
subplot(2,2,2); stem(n,imagX_DFT); title(‘Imag {DFT[x(n)]}‘); axis([-0.5,10.5,-20,20]);
xlabel(‘k‘); grid on;

k = 0:1:5; w = 2*pi/10*k;
subplot(2,2,3); stem(w/pi,magX_DFT); title(‘Magnitude DTFT‘); %axis([-0.5,10.5,-5,50]);
xlabel(‘frequency in \pi units‘); grid on;
subplot(2,2,4); stem(w/pi,phaX_DFT); title(‘Angle {DFT[x(n)]}‘); %axis([-0.5,10.5,-20,20]);
xlabel(‘frequency in \pi units‘); grid on;

%% -----------------------------------------------------------------
%%                    END   b
%% -----------------------------------------------------------------
运行结果:


由上图看出,性质(5.34)成立:


《DSP using MATLAB》示例Example5.10
标签:atl pre using original frequency 示例 label png end
原文地址:http://www.cnblogs.com/ky027wh-sx/p/6139809.html