标签:初始化 super 回归 函数 三维 ann array asa session
线性回归属于监督学习(Supervise Learning),就是Right answer is given。 课程中,举了一个估计房产价格的例子,在此,我就直接使用两组数据去作为例子使用线性回归,拟合出效果最好的曲线。


下面我举一个很浅显的例子,验证线性回归算法的作用。
假设,有两组数据:
train_x = [1,2,3,4,5,6,7,8,9,10,11,12,13,14]
train_y = [3,5,7,9,11,13,15,17,19,21,23,25,27,29]
仔细观察这两组数据,发现它们满足:y = 2x +1这个函数关系,那么怎么使用线性回归得出这个结果呢?从机器学习的角度来说,就是怎么使得计算机能从已知的有限个数据中,拟合出最合适的曲线,并预测其他x值对应的y值。
针对已知的数据,如果使用线性模型,由于只有一个特征/输入变量(此处指的是x),则属于单变量线性回归。预测函数为:
Python中使用Tensorflow库的实现:
#Input data
train_x = np.asarray([1,2,3,4,5,6,7,8,9,10,11,12,13,14])
train_y = np.asarray([3,5,7,9,11,13,15,17,19,21,23,25,27,29])

#Create the linear model
X = tf.placeholder("float")
W = tf.Variable(np.random.randn(),name="theta1")
b = tf.Variable(np.random.randn(),name="theta0")
pred = tf.add(tf.mul(W,X),b)
建立基本模型之后,就要对模型误差进行评估,而这个评估的函数,就是代价函数。
这里我们使用预测数据值和偏差的平方去表示模型的误差,式子如2.1所示。在tensorflow中实现:
m = train_x.shape[0]  #数据总个数
cost = tf.reduce_sum(tf.pow(pred-Y, 2))/(2*m)
构造模型的目标,当然是是模型误差最小化,因此,目标函数为:
而怎么实现呢?在本例中,我们使用梯度下降,即:
其中,该式针对本例的意思,是:
这样,每进行一次运算,J(θ)的值就会进一步减少。
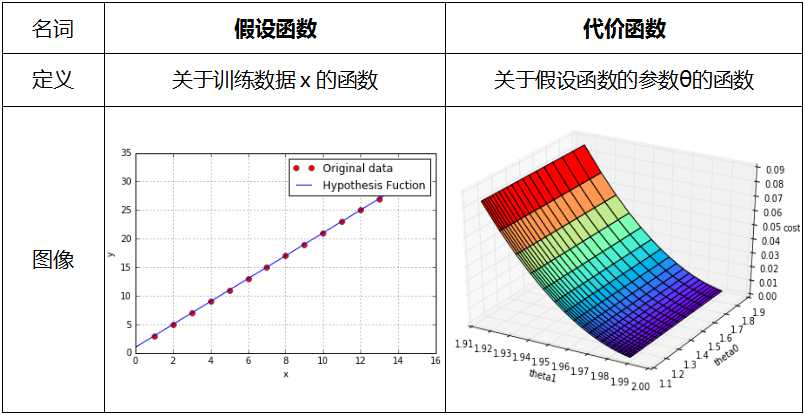
模型理解的关键是切实理清假设函数和代价函数的作用。如下图所示:
注:图像均使用python下的matplotlib.pyplot和mpl_toolkits.mplot3d库所作。
显然,预测函数是根据训练数据而定的,而代价函数是为假设函数服务的,通过优化代价函数,就能找出最佳的参数赋给假设函数,从而找出最佳的模型。同时,由上图可见,当参数θ有两个的时候,代价函数是一个三维图,所以当参数更多的时候就是更多维的图。
程序源码:
#!/usr/bin/env python2
#-*- coding:utf-8 -*-
import tensorflow as tf
import numpy as np
import matplotlib.pyplot as plt
import sys

reload(sys)
sys.setdefaultencoding(‘utf8‘)

#Input data
train_x = np.asarray([1,2,3,4,5,6,7,8,9,10,11,12,13,14])
train_y = np.asarray([3,5,7,9,11,13,15,17,19,21,23,25,27,29])

X = tf.placeholder("float")
Y = tf.placeholder("float")

#W,b分别代表θ1,θ0
#np.random.rann()用于初始化W和b
W = tf.Variable(np.random.randn(),name="theta1")
b = tf.Variable(np.random.randn(),name="theta0")

#1 假设函数的确定
pred = tf.add(tf.mul(W,X),b)

#2 代价函数的确定
m = train_x.shape[0]  #
cost = tf.reduce_sum(tf.pow(pred-Y, 2))/(2*m)

#3 梯度下降
learning_rate = 0.01
optimizer = tf.train.GradientDescentOptimizer(learning_rate).minimize(cost)
#至此模型构建完成

#Initialize the variables
init = tf.initialize_all_variables()

#Lauch the graph
with tf.Session() as sess:
    sess.run(init)
    for epoch in range(1000):   #进行100次的迭代训练
        for (x,y) in zip(train_x,train_y):
            sess.run(optimizer,feed_dict={X:x,Y:y})
        #display
        if(epoch+1)%50==0:
            c=sess.run(cost,feed_dict={X:train_x,Y:train_y})
            print "step:%04d, cost=%.9f, θ1=%s, θ0=%s"%((epoch+1),c,sess.run(W),sess.run(b))
    print "Optimzer finished!"
    #training_cost = sess.run(cost,feed_dict={X:train_x,Y:train_y})

    print "The final is y=%sx+%s"%(sess.run(W),sess.run(b))
    plt.plot(train_x,train_y,‘ro‘,label="Original data")
    plt.grid(True)
    plt.plot(range(1,))
    plt.plot(train_x,sess.run(W)*train_x+sess.run(b),label="Fitted line")
    plt.legend()
    plt.show()
程序运行结果:
step:0050, cost=0.068827711, θ1=1.92573, θ0=1.77617
step:0100, cost=0.055033159, θ1=1.93359, θ0=1.69404
step:0150, cost=0.044003420, θ1=1.94061, θ0=1.62061
step:0200, cost=0.035184156, θ1=1.9469, θ0=1.55494
step:0250, cost=0.028132409, θ1=1.95252, θ0=1.49622
step:0300, cost=0.022494031, θ1=1.95754, θ0=1.44372
step:0350, cost=0.017985778, θ1=1.96203, θ0=1.39677
step:0400, cost=0.014381131, θ1=1.96605, θ0=1.35479
step:0450, cost=0.011498784, θ1=1.96964, θ0=1.31725
step:0500, cost=0.009194137, θ1=1.97285, θ0=1.28368
step:0550, cost=0.007351381, θ1=1.97573, θ0=1.25366
step:0600, cost=0.005878080, θ1=1.97829, θ0=1.22682
step:0650, cost=0.004699936, θ1=1.98059, θ0=1.20282
step:0700, cost=0.003757860, θ1=1.98265, θ0=1.18136
step:0750, cost=0.003004675, θ1=1.98448, θ0=1.16217
step:0800, cost=0.002402445, θ1=1.98612, θ0=1.14501
step:0850, cost=0.001920973, θ1=1.98759, θ0=1.12967
step:0900, cost=0.001535962, θ1=1.9889, θ0=1.11595
step:0950, cost=0.001228108, θ1=1.99008, θ0=1.10368
step:1000, cost=0.000981987, θ1=1.99113, θ0=1.09271
Optimzer finished!
The final is y=1.99113x+1.09271

显然,最终得出的曲线很接近y=2x+1,如果增加训练的次数会更加接近。成功验证了线性回归算法!
标签:初始化 super 回归 函数 三维 ann array asa session
原文地址:http://www.cnblogs.com/louishuang2016928/p/6289133.html