标签:效果 mon tar 需要 deb 显示 shift 调试过程 大写
本文知识点:
使用Rstudio调试的基础知识
点击行号的左侧,即可设置断点(或者按下Shift+F9),如果没有出现,反而出现下图的警告:

那么只是因为我的坏习惯——写一段脚本测试的时候都是新建,但不save到本地,不喜欢保存,写的差不多了才开始取名字保存....
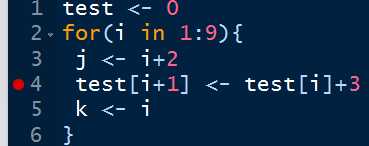
写一个for循环测试下:
test <-0for(i in1:9){ j <- i+2 test[i+1]<- test[i]+3 k <- i}
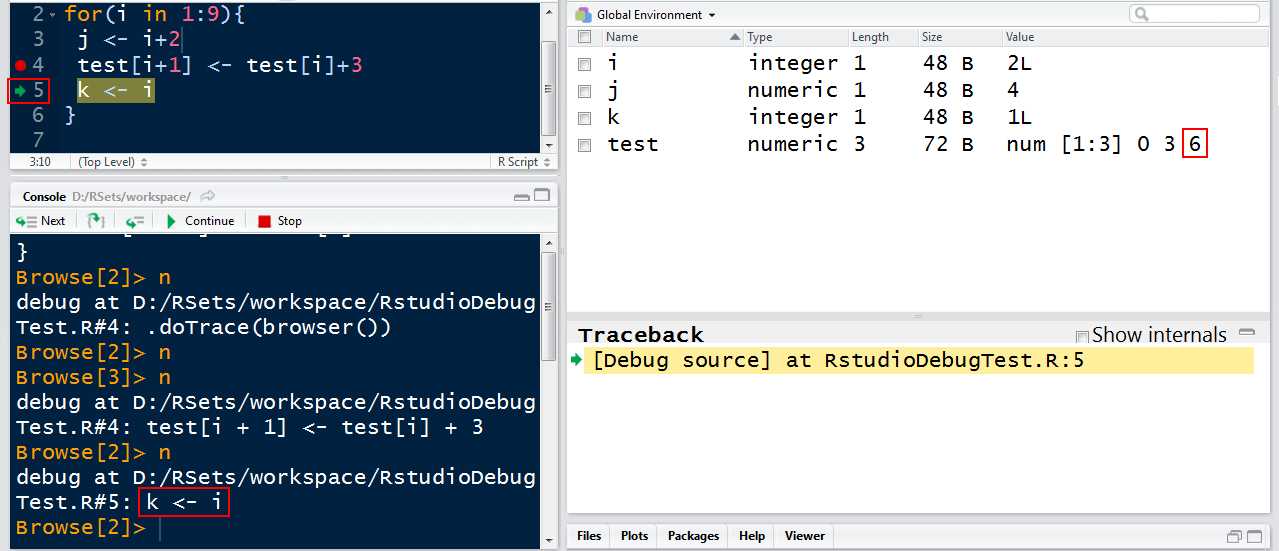
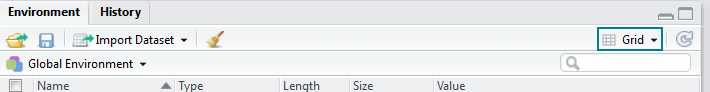
将environment窗口下,选择grid(如果选来是list的话,换到grid方便查看变量的值)
第一步
点击脚本窗口的source
(注意,不是run/ctrl+enter,如果这样运行断点是不会发挥作用的)
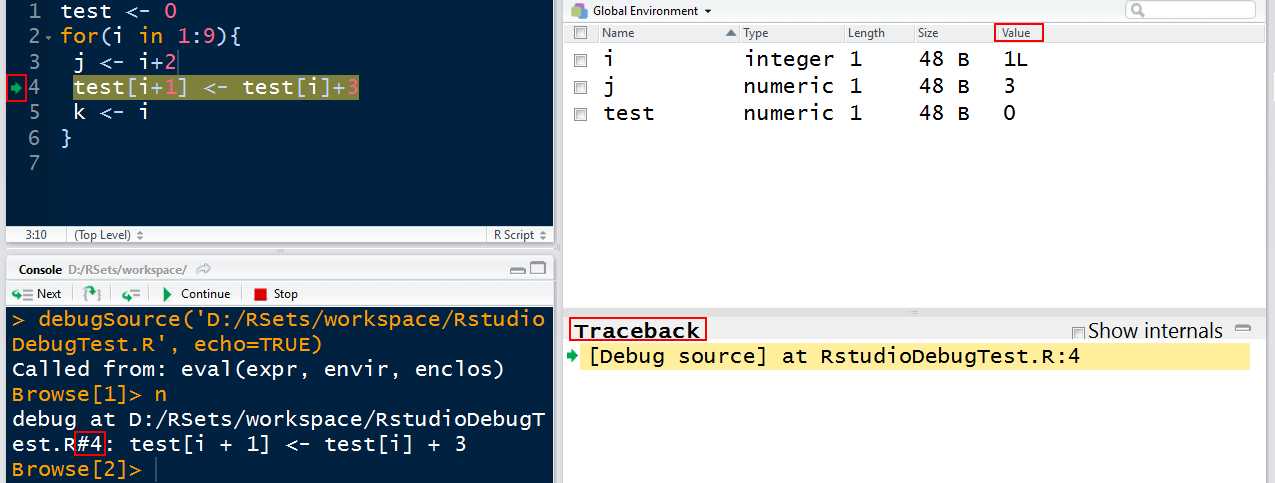
绿色箭头指向的是当前的停留在的行,即#4代表的第四行代码
在控制台输入n或者点击next,即可运行下一句。(其实我们可以看到,这个断点和我们直接在那个地方加一句browse()代码的效果是一样的)
第二步
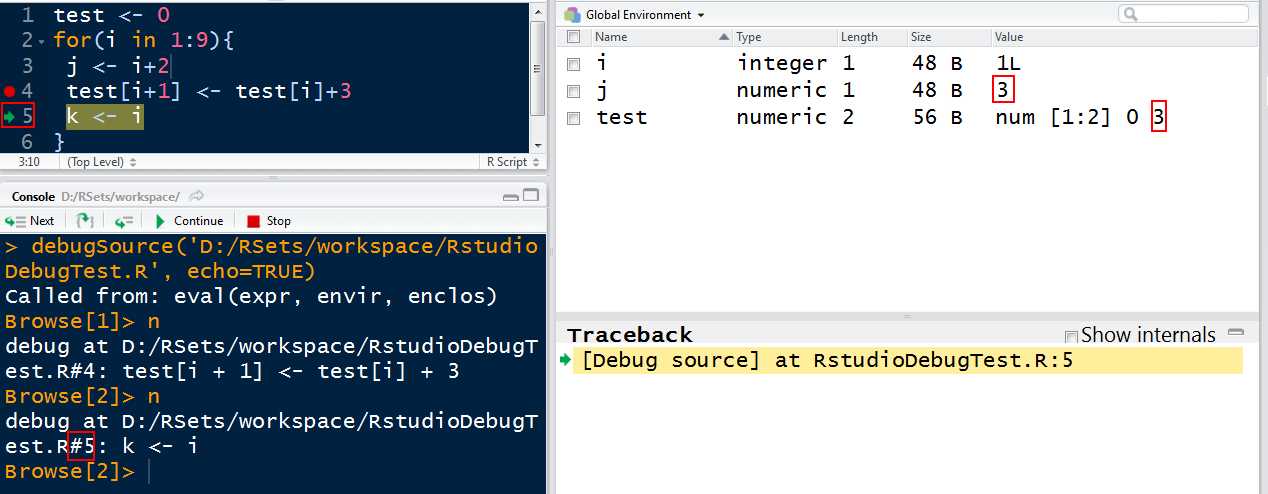
所以,我们注意到,点击下一句的时候,绿色箭头指向了下一句,上一句才被执行。
也就是说,当前显示#5,其实上是#5没有执行,只要#5之前的执行了。
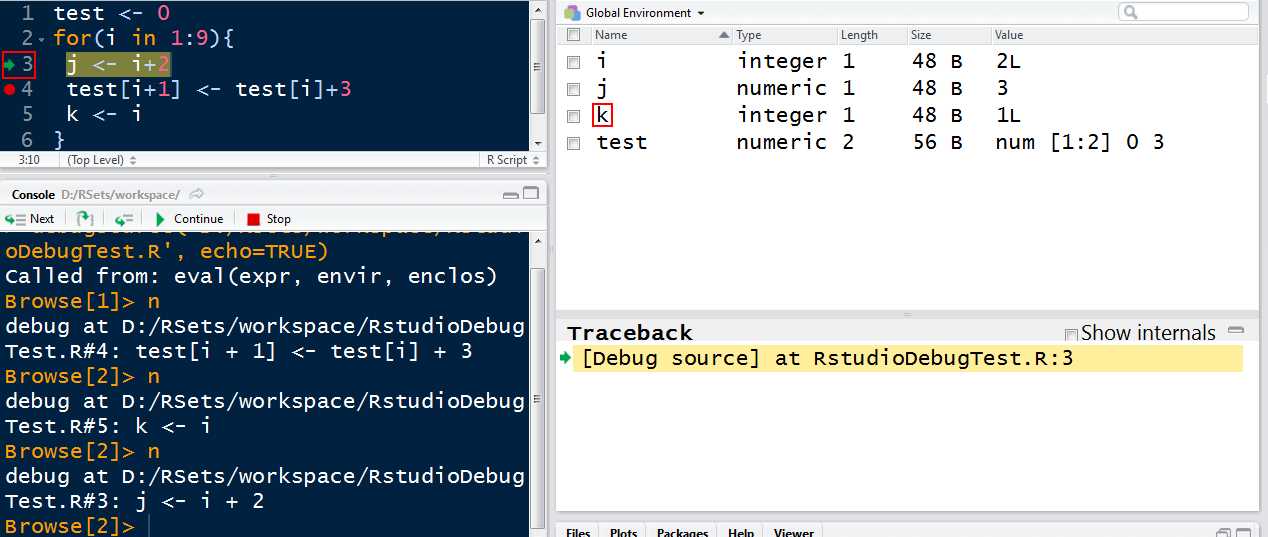
第三步
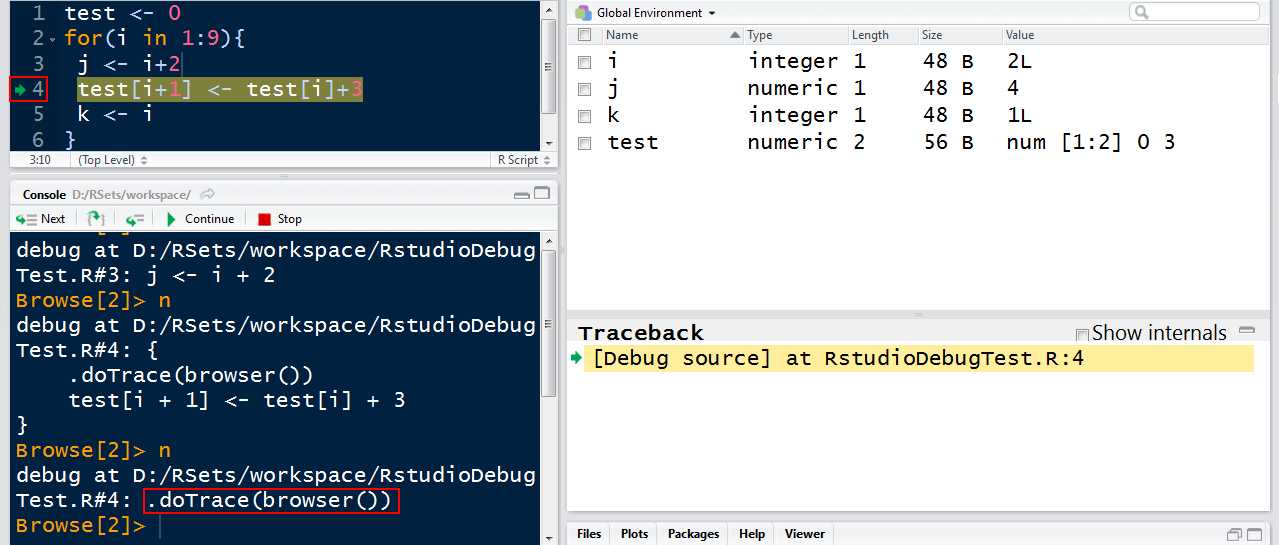
第四步:
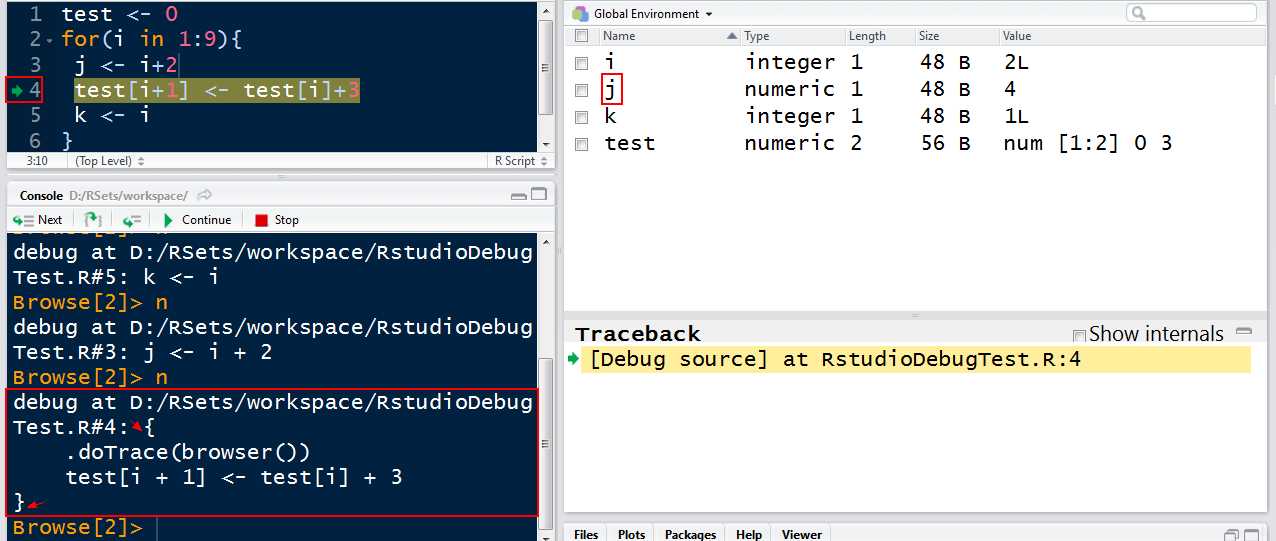
其实是从第二次开始:
{.doTrace(browser()) test[i +1]<- test[i]+3}
把他们组合在一起了,然后第五步和第六步就是分别进入这两步。
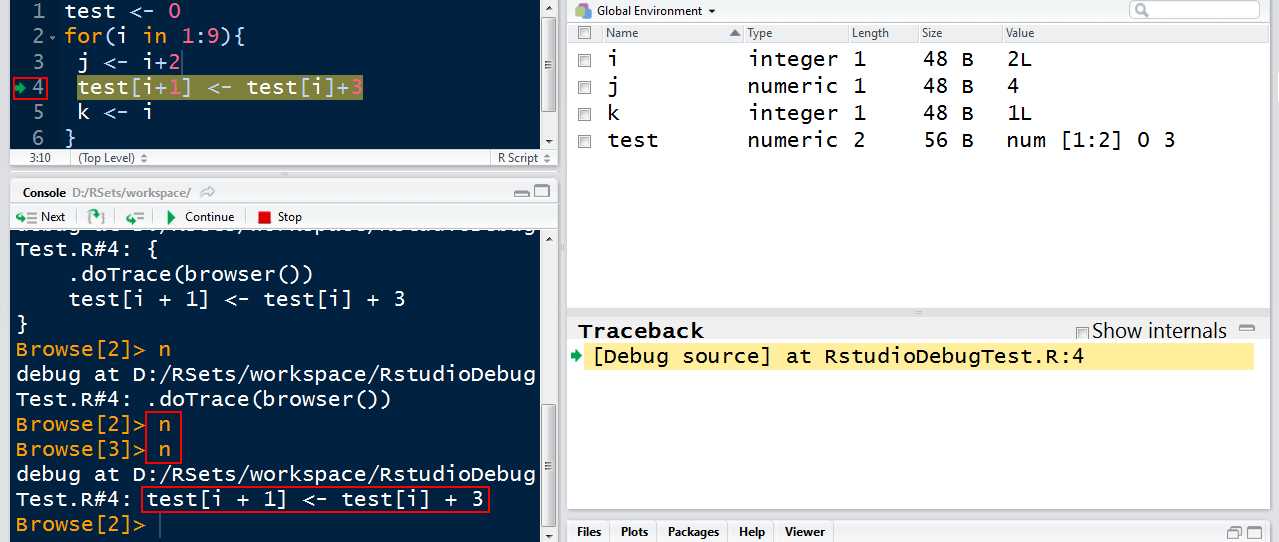
第五步:
第六步:
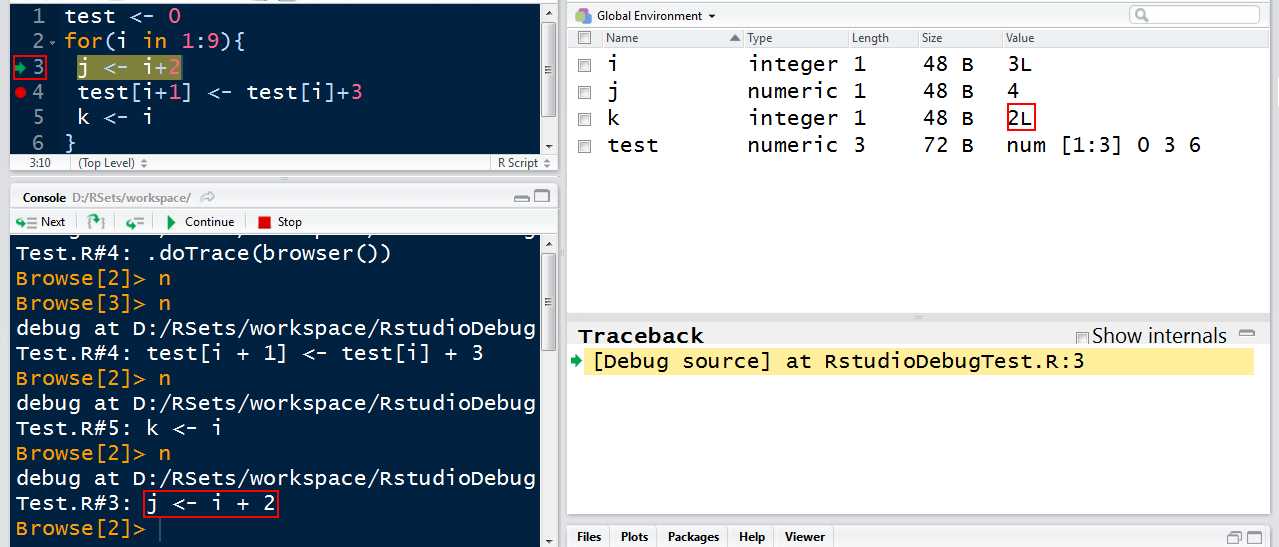
第七步(回归到一般的代码顺序逻辑):
第八步
按下stop或者输入大写的Q,推出debug模式。
如果我们在第一步之后就按下continue按钮
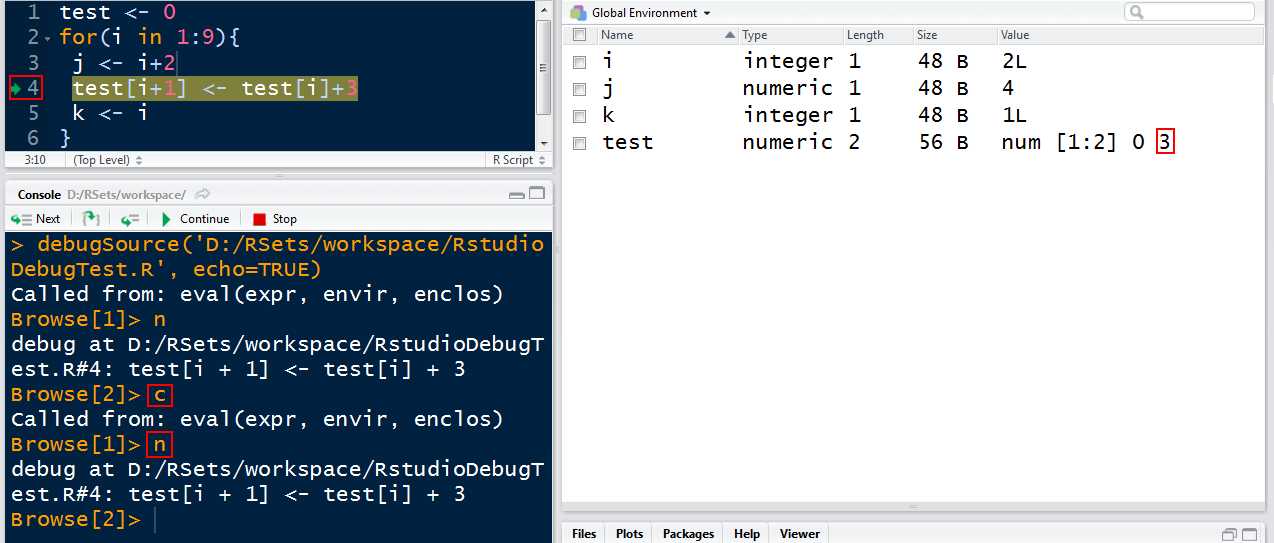
那么相当于我们输入一个c和n
continue的作用是执行,直至遇到下一个断点的位置。
所以呢,我们真正调试的时候一般还是用continue较多吧。
上面为止的是Editor breakpoints
Editor breakpoints work by injecting some tracing code into the R function object.
(所以之前看到了.doTrace)
-------------------------------------------------------------------------------------------
接下来是
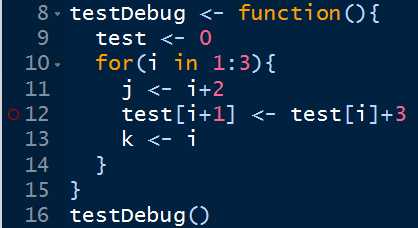
也就是在函数里,那么是这种空心红点,且伴随有警告,
(其实反正就算是之前的Editor breakpoints也是需要source才生效,我觉得这个警告有点多余啊)
如果我们修改了内容,会出现如下的警告。

ctrl+S保存即可,那么也就是说,我们每次修改,都应该重新source才可进行调试的,这很正常啊。
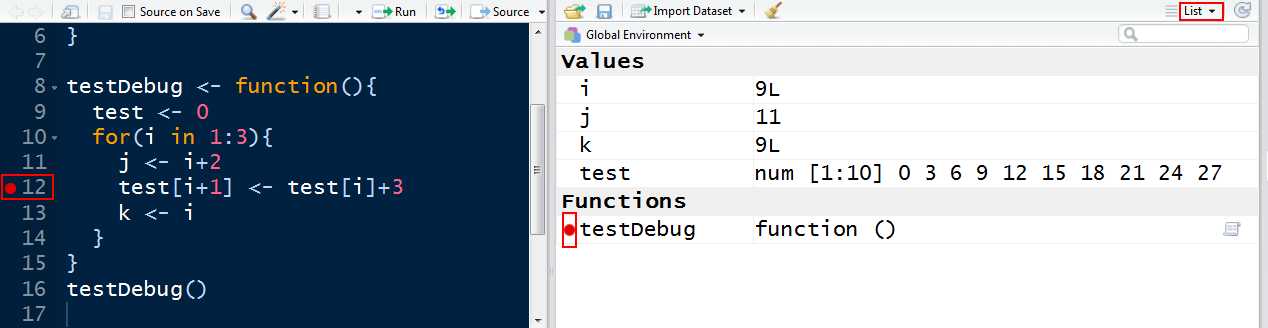
当我们调试结束后,会发现变成如下情况:

此后,如果我们再通过testDebug()语句调用函数,那么函数内部的这个断点就开始起作用啦~
而且此后,我们再在函数内添加断点,就都是Editor breakpoints
(The circle outline indicates that RStudio is aware of the breakpoint, but that it hasn’t been injected. In most cases, you can source() the file to resolve the problem.但是呢,并不如他所说,其实通过source并未能直接解决问题,而是更显麻烦的一点点运行)
-------------------------------------------------------------------------------------------
browser()——直接run/或者ctrl+enter即可,无需source
browser()可以看作最低水平的调试工具,它是你代码的一部分,不依赖于工具和环境的。
browser()虽然原始,但是在一些按条件调试的情况下还是蛮有用的
for(i in1:10){if(i ==5) browser()}
这里的意思是,从i等于5开始调试(不是仅有i=5的时候调试一次哦~),直至一个循环或者函数结束,调试结束。(参考的文章中的start_work()压根没有这个函数呃)
-------------------------------------------------------------------------------------------
debugonce()——直接run/或者ctrl+enter即可,无需source
比如:
library(fGarch) debugonce(fGarch::garchFit)# debugonce(fGarch::.garchArgsParser)# debugonce(fGarch::.garchFit)da=read.table("m-intcsp7309.txt",header=T)intc=log(da$intc+1)m4=garchFit(~1+garch(1,1),data=intc,trace=F)
由于有了debugonce(包名::包中的函数)
当执行到m4=garchFit(~1+garch(1,1),data=intc,trace=F)一行的时候,会自动进入调试模式
如果我们还想调试garchFit中的.garchArgsParser函数和.garchFit函数,只要在运行前写上即可(上面的代码块中已经注释掉了)
debugonce() sets a one-shot breakpoint–that is, the function will enter the debugger the very next time it runs, but not after that. If you want to debug a function every time it executes, call debug(...) on the function. Call undebug(...) on the function when you no longer want to debug the function each time it executes.
debugonce(x)设置后,一旦x函数运行,就会进入调试器。
——(只执行一次)
如果想要x函数每次执行都进入调试器,那么只要在想要这么做的地方的最开始放上debug(x),末尾处放上undebug(x),那么他们之间的代码块,只要遇上x函数被执行,都会进入调试器
——(执行多次)
debug(x)
代码块
undebug(x)
-------------------------------------------------------------------------------------------
If you’re diagnosing a specific error, you can have RStudio halt execution at the point where the error is raised. To do this, go to Debug -> On Error and change the value from “Error Inspector” to “Break in Code”.
让Rstudio在发生错误的那一行代码处停止执行。
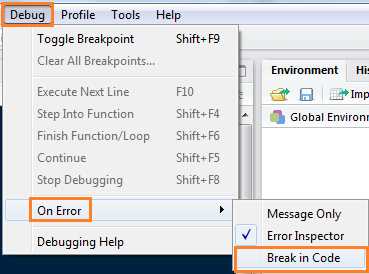
只需要在debug——on error——选择break in code
可是我修改之后然并卵啊,试验了很久都没倒腾出来....
存疑,欢迎指正!
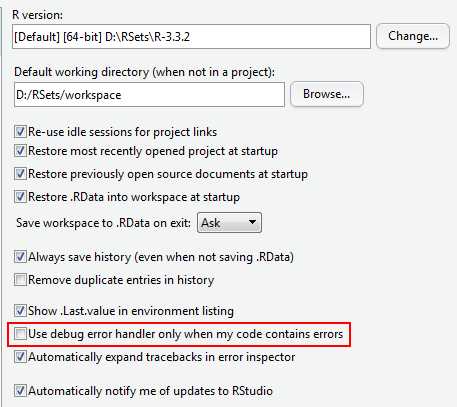
To keep the the debugger from being invoked whenever any error anywhere happens, RStudio does not invoke the debugger if it looks like none of your own code is on the stack. If you find that this is excluding an error you want to catch, go to Tools -> Global Options and uncheck “Use debug error handler only when my code contains errors”.
options(error = browser())test <-0for(i in1:9){ plot("abc") j <- i+2 test[i+1]<- test[i]+3 k <- i}
取消这个打钩(且有勾选break in code),上述的代码运行完,会自动进入调试模式。
options(error = browser()) ——设置完后,任意error都会进入调试模式
options(error = NULL) ——还原上一个命令,不然每个错误都进入太累了
-------------------------------------------------------------------------------------------
调试器:
n or EnterF10Execute next statement 可以按下回车键,直接运行下一步
sShift+F4Step into function 即第二个按钮,进入函数
fShift+F6Finish function/loop 结束该函数或循环
cShift+F5Continue running 继续执行直到下一个断点
QShift+F8Stop debugging 停止调试
那么先到这里,这部分太基础了,之后我结合Rstudio的调试器以fGarch模型中的garchFit函数具体来说明更实用的调试过程,这样有助于我们高效地查看源码,我感受到了老司机的召唤!
本文参考:
使用RStudio调试基础学习(一)
标签:效果 mon tar 需要 deb 显示 shift 调试过程 大写
原文地址:http://www.cnblogs.com/xuanlvshu/p/6351825.html