标签:ima mesh measure ack man oss false erp column
%clear
% http://www.peteryu.ca/tutorials/matlab/visualize_decision_boundaries
% load RankData
% NumTrain =200;
%load RankData2
%(11,10), [15,15];[20,15];
%[5,0,0,5],[2,0;0,5];[5,0;0,2];
mu = [13,8.5];
sigma = [0.4,-0.2;-0.2,0.4];
rng default % For reproducibility
r1 = mvnrnd(mu,sigma,60);
mu = [13,7.5];
sigma = [1,-0.2;-0.2,1];
r11 = mvnrnd(mu,sigma,10);
mu = [15,10];
sigma = [0.4,0;0,0.4];
r2 = mvnrnd(mu,sigma,60);
r22 = mvnrnd(mu,sigma,10);
mu = [16.5,8.5];
sigma = [0.5,0.2;0.2,0.4];
r3 = mvnrnd(mu,sigma,60);
mu = [16.5,7.5];
sigma = [1,0.2;0.2,1];
r33 = mvnrnd(mu,sigma,10);
X=[r1;r2;r3];
y=[ones(size(r1,1),1);2*ones(size(r2,1),1);3*ones(size(r3,1),1)];
xrange = [min(X(:,1))-1 max(X(:,1))+1];
yrange = [min(X(:,2))-1.1 max(X(:,2))+1];
% mu = [-3.5,-3.5];
% sigma = [1,-0.5;-0.5,2];
% rng default % For reproducibility
% r1 = mvnrnd(mu,sigma,50);
% mu = [0,0];
% sigma = [2,-0.4;-0.4,1];
% r2 = mvnrnd(mu,sigma,50);
% mu = [3.5,3.5];
% sigma = [1,-0.5;-0.5,2];
% r3 = mvnrnd(mu,sigma,50);
% X=[r1;r2;r3];
% y=[ones(size(r1,1),1);2*ones(size(r2,1),1);3*ones(size(r3,1),1)];
% xrange = [-8 8];
% yrange = [-8 8];
% Traindata=X; Targets=y;
% selectmodel = ‘ParNonLinearDualBoundSVORIM‘;
% ker = ‘linear‘;
% %# grid of parameters
% folds = 5; e=0.1; rho=1;
% %[C1, C2] = meshgrid(-3:3,-3:3);
% C1=-3:3;
% C2=C1;
% %# grid search, and cross-validation
% Cv_acc = zeros(1, numel(C1));
% for i = 1:numel(C1)
% % Cv_acc(i) =AccADMMforSVOR(traindata, targets, 10^C1(i), 10^ C2(i), e,rho, folds);
% f =AccNonLinearDualSVOR(Traindata, Targets, 10^C1(i), 10^ C2(i), e,rho, folds, selectmodel, ker,0.1);
% Cv_acc(i) = f.abserr;
% end
% %# pair (lambda,rho) with best accuracy
% [~,Idx] = max(Cv_acc);
% Best_C1 = 10^C1(Idx);
% Best_C2= 10^C2(Idx);
% c1 =Best_C1;
% c2 =Best_C2;
lambda = 20;
rho = 1;
c1 =1.5;
c2 =4;
epsilon = 0.1;
result=[];
ker = ‘linear‘;
% % ker = ‘rbf‘;
sigma = 1/1000;
method=3
j=1
contour_level1 = [-epsilon, 0, epsilon];
contour_level2 = [-epsilon, 0, epsilon];
contour_level0 = [-1,0, 1];
% xrange = [-5 5];
% yrange = [-5 5];
% step size for how finely you want to visualize the decision boundary.
inc = 0.01;
% generate grid coordinates. this will be the basis of the decision
% boundary visualization.
[x1, x2] = meshgrid(xrange(1):inc:xrange(2), yrange(1):inc:yrange(2));
% size of the (x, y) image, which will also be the size of the
% decision boundary image that is used as the plot background.
image_size = size(x1);
xy = [x1(:) x2(:)]; % make (x,y) pairs as a bunch of row vectors.
%xy = [reshape(x, image_size(1)*image_size(2),1) reshape(y, image_size(1)*image_size(2),1)]
% loop through each class and calculate distance measure for each (x,y)
% from the class prototype.
% calculate the city block distance between every (x,y) pair and
% the sample mean of the class.
% the sum is over the columns to produce a distance for each (x,y)
% pair.
switch method
case 1
par = NonLinearDualSVORIM(X, y, c1, c2, epsilon, rho, ker, sigma);
f = TestPrecisionNonLinear(par,X, y,X, y, ker,epsilon,sigma);
% set up the domain over which you want to visualize the decision
% boundary
d = [];
for k=1:max(y)
d(:,k) = decisionfun(xy, par, X,y,k,epsilon, ker,sigma)‘;
end
[~,idx] = min(abs(d)/par.normw{k},[],2);
contour_level=contour_level1;
nd=max(y);
case 2
par = ParNonLinearDualBoundSVORIM(X, y, c1, c2, epsilon, rho, ker, sigma);
f = TestPrecisionNonLinear(par,X, y,X, y, ker,epsilon,sigma);
% set up the domain over which you want to visualize the decision
% boundary
d = [];
for k=1:max(y)
d(:,k) = decisionfun(xy, par, X,y,k,epsilon, ker,sigma)‘;
end
[~,idx] = min(abs(d),[],2);
IDX{1}=idx;
dd = d(:,2:end)+d(:,1:end-1);
IDX{2} = 1+sum(dd>0,2);
contour_level=contour_level1;
nd=max(y);
case 3
% par = NewSVORIM(X, y, c1, c2, epsilon, rho);
par = LinearDualSVORIM(X,y, c1, c2, epsilon, rho); % ADMM for linear dual model
d = [];
for k=1:max(y)
w= par.w(:,k)‘;
d(:,k) = w*xy‘-par.b(k);
end
[~,idx] = min(abs(d),[],2);
contour_level =contour_level1;
nd=max(y)-1;
IDX{1}=idx;
dd = d(:,2:end)+d(:,1:end-1);
IDX{2} = 1+sum(dd>0,2);
contour_level=contour_level1;
nd=max(y);
case 4
path=‘C:\Users\hd\Desktop\svorim\svorim\‘;
name=‘RankData2‘;
k=0;
fname1 = strcat(path, name,‘_train.‘, num2str(k));
fname2 = strcat(path, name,‘_targets.‘, num2str(k));
fname2 = strcat(path, name,‘_test.‘, num2str(k));
Data=[X y];
save(fname1,‘Data‘,‘-ascii‘);
save(fname2,‘y‘,‘-ascii‘);
save(fname2,‘X‘,‘-ascii‘);
command= strcat(path,‘svorim -F 1 -Z 0 -Co 10 -p 0 -Ko 1/200 C:\Users\hd\Desktop\svorim\svorim\‘, name, ‘_train.‘, num2str(k));
% command= ‘C:\Users\hd\Desktop\svorim\svorim\svorim -F 1 -Z 0 -Co 10 C:\Users\hd\Desktop\svorim\svorim\RankData2_train.0‘;
% command=‘C:\Users\hd\Desktop\svorim\svorim\svorim -F 1 -Z 0 -Co 10 G:\datasets-orreview\discretized-regression\5bins\X4058\matlab\mytask_train.0‘
dos(command);
fname2 = strcat(fname1, ‘.svm.alpha‘);
alpha_bais = textread(fname2);
r=length(unique(y));
model.alpha=alpha_bais(1:end-r+1);
model.b=alpha_bais(end-r+2:end);
for k=1:r-1
d(:,k)=model.alpha‘*Kernel(ker,X‘,xy‘,sigma)- model.b(k);
end
pretarget=[];idx=[];
for i=1:size(xy,1)
idx(i) = min([find(d(i,:)<0,1,‘first‘),length(model.b)+1]);
end
contour_level=contour_level2;
nd=max(y)-1;
case 5
d = [];contour_level = [-1,0, 1];
libsvm_options=[‘-s 0 -t 0 -c ‘ num2str(c1) ‘ -q‘];
for i=1:max(y)-1
y1=y;
y1(y1<=i)=-1;
y1(y1>i)=1;
model = svmtrain(y1, X, libsvm_options);
[~,~, d(:,i)] = svmpredict(ones(size(xy,1),1), xy, model, ‘-q‘);
end
nd=max(y)-1;
case 6
par = LinearDualSVORIM(X,y, c1, c2, epsilon, rho); % ADMM for linear dual model
d = [];
for k=1:max(y)
w= par.w(:,k)‘;
d(:,k) = w*xy‘-par.b(k);
end
[~,idx] = min(abs(d)/norm(par.w),[],2);
contour_level=contour_level1;
nd=max(y)-1;
case 7
Algorithm = ELM();
name = ‘ELM‘;
train.patterns =X;
train.targets = y;
test.patterns = xy;
test.targets = zeros(size(xy,1));
info = Algorithm.runAlgorithm(train,test,param);
idx = info.predictedTest;
nd=max(y)-1;
end
X=par.X; y=par.Y;
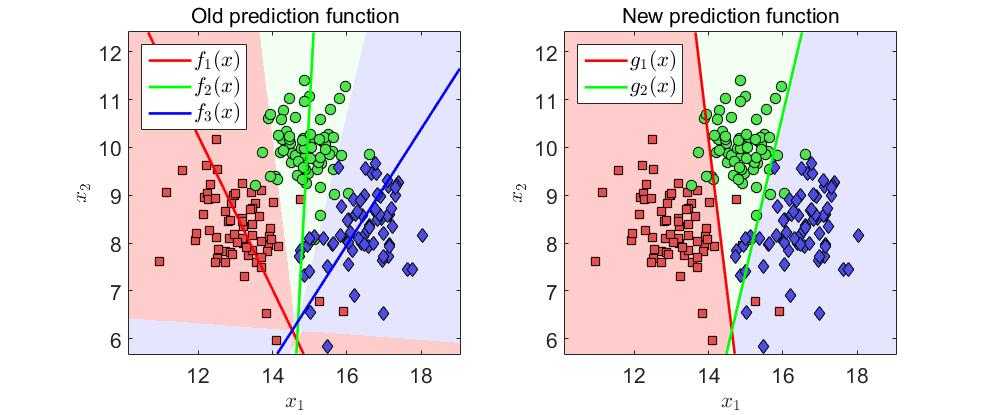
pred = {‘Old prediction function‘,‘New prediction function‘};
marker = {‘square‘,‘o‘,‘diamond‘};
for s=1:2
subplot(1,2,s)
idx = IDX{s};
% % reshape the idx (which contains the class label) into an image.
decisionmap = reshape(idx, image_size);
%show the image
imagesc(xrange,yrange,decisionmap);
hold on;
set(gca,‘ydir‘,‘normal‘);
cmap = [0.95 1 0.95; 0.9 0.9 1;1 0.8 0.8; 0.95 1 0.95; 0.9 0.9 1;];
colormap(cmap);
% numColors = 5;
% jet(numColors)
% colormap(jet(numColors))
% scatter(X(:,1), X(:,2), 20, y)
color = {[.9 .3 .3],[.3 .9 .3],[.3 .3 .9]};
%color = {‘r.‘,‘go‘,‘b*‘,‘r.‘,‘go‘,‘b*‘};
% SVs = (par.SVs{2}>1e-6);
X = [X;r11;r22;r33];
y=[y;ones(10,1);2*ones(10,1);3*ones(10,1)];
for i=1:max(y)
% show the SVs using biger marker
% plot(X(y==i&SVs==1,1),X(y==i&SVs==1,2), ‘o‘, ‘MarkerFaceColor‘, color{i}, ‘MarkerEdgeColor‘,‘k‘);
hold on
% % plot the points of not SVs
% plot(X(y==i&SVs~=1,1),X(y==i&SVs~=1,2), ‘o‘, ‘MarkerFaceColor‘, color{i}, ‘MarkerEdgeColor‘,color{i});
p{i}= plot(X(y==i,1),X(y==i,2),‘o‘, ‘Marker‘,marker{i}, ‘MarkerFaceColor‘, color{i}, ‘MarkerEdgeColor‘,‘k‘,‘MarkerSize‘,8);
end
% set(gca,‘XLim‘,[-8 8],‘YLim‘,[-8 8],‘ydir‘,‘normal‘,‘YTick‘,[-8 0 8],‘XTick‘,[-8 0 8], ‘FontSize‘,14);
color1 = {‘r.‘,‘go‘,‘b*‘,‘r.‘,‘go‘,‘b*‘};
if(s==1)
for k=1:3
hold on
decisionmapk = reshape(d(:,k), image_size);
h{k}=contour(x1,x2, decisionmapk, [contour_level(2) contour_level(2) ], color1{k},‘LineWidth‘,2);
end
else
for k=1:2
hold on
decisionmapk = reshape(dd(:,k), image_size);
h{k}=contour(x1,x2, decisionmapk, [contour_level(2) contour_level(2) ], color1{k},‘LineWidth‘,2);
end
end
set(gca,‘ydir‘,‘normal‘,‘FontSize‘,16);
xlabel(‘$$x_1$$‘,‘FontSize‘,16,‘Interpreter‘,‘latex‘);
ylabel(‘$$x_2$$‘,‘FontSize‘,16,‘Interpreter‘,‘latex‘)
title(pred{s},‘FontSize‘,16,‘FontWeight‘,‘normal‘);
hasbehavior(p{1},‘legend‘,false);
hasbehavior(p{2},‘legend‘,false);
hasbehavior(p{3},‘legend‘,false);
if(s==1)
l= legend(‘$$f_1(x)$$‘,‘$$f_2(x)$$‘,‘$$f_3(x)$$‘,‘Location‘,‘northwest‘);
else
l= legend(‘$$g_1(x)$$‘,‘$$g_2(x)$$‘,‘Location‘,‘northwest‘);
end
set(l,‘Interpreter‘,‘latex‘,‘FontSize‘,16)
end
% color = {‘r.‘,‘go‘,‘b*‘,‘r.‘,‘go‘,‘b*‘};
% marker = {‘square‘,‘o‘,‘diamond‘};
% SVs = (par.SVs{j}>1e-4);
% for i=1:max(y)
% plot(X(y==i&SVs~=1,1),X(y==i&SVs~=1,2),color{i},‘Marker‘,marker{i},‘MarkerSize‘,6);
% hold on
% plot(X(y==i&SVs==1,1),X(y==i&SVs==1,2),color{i},‘Marker‘,marker{i},‘MarkerSize‘,8,‘LineWidth‘,2);
% end
% color1 = {‘r-‘,‘g--‘,‘b*‘,‘r.‘,‘go‘,‘b*‘};
% set(gca,‘XLim‘,[-8 8],‘YLim‘,[-8 8],‘ydir‘,‘normal‘,‘YTick‘,[-8 0 8],‘XTick‘,[-8 0 8], ‘FontSize‘,14);
%
%
%
% for j=1:3
% figure(j);
%
% color = {‘r.‘,‘go‘,‘b*‘,‘r.‘,‘go‘,‘b*‘};
% marker = {‘square‘,‘o‘,‘diamond‘};
% SVs = (par.SVs{j}>1e-4);
% for i=1:max(y)
% plot(X(y==i&SVs~=1,1),X(y==i&SVs~=1,2),color{i},‘Marker‘,marker{i},‘MarkerSize‘,6);
% hold on
% plot(X(y==i&SVs==1,1),X(y==i&SVs==1,2),color{i},‘Marker‘,marker{i},‘MarkerSize‘,8,‘LineWidth‘,2);
% end
%
% color1 = {‘r-‘,‘g--‘,‘b*‘,‘r.‘,‘go‘,‘b*‘};
% set(gca,‘XLim‘,[-8 8],‘YLim‘,[-8 8],‘ydir‘,‘normal‘,‘YTick‘,[-8 0 8],‘XTick‘,[-8 0 8], ‘FontSize‘,14);
%
%
%
% switch j
% case 1
% for k=j
% hold on
% decisionmapk = reshape(d(:,k), image_size);
% contour(x1,x2, decisionmapk, [contour_level(1) contour_level(1) ], color{k},‘Fill‘,‘off‘);
% contour(x1,x2, decisionmapk, [contour_level(2) contour_level(2) ], color{k},‘Fill‘,‘off‘,‘LineWidth‘,2);
% contour(x1,x2, decisionmapk, [contour_level(3) contour_level(3) ], color{k},‘Fill‘,‘off‘);
% contour(x1,x2, decisionmapk, [contour_level0(3) contour_level0(3) ], color1{k},‘Fill‘,‘off‘,‘LineWidth‘,0.5,‘LineStyle‘,‘--‘);
% end
% % Create text
% text(‘FontSize‘,14,‘Rotation‘,-33,‘Interpreter‘,‘latex‘,...
% ‘String‘,‘${\bf w}_1^T{\bf x}+b_1=0$‘,...
% ‘Position‘,[-1.32643496989101 -4.45623941276116 0]);
%
% % Create text
% text(‘FontSize‘,14,‘Rotation‘,-33,‘Interpreter‘,‘latex‘,...
% ‘String‘,‘${\bf w}_1^T{\bf x}+b_1=1$‘,...
% ‘Position‘,[-7.54606265181257 4.22134387351778 0]);
%
% % Create text
% text(‘FontSize‘,14,‘Rotation‘,-33,‘Interpreter‘,‘latex‘,...
% ‘String‘,‘${\bf w}_1^T{\bf x}+b_1=-\epsilon$‘,...
% ‘Position‘,[-7.30669549988078 -4.03387916431394 0]);
%
% % Create text
% text(‘FontSize‘,14,‘Rotation‘,-33,‘Interpreter‘,‘latex‘,...
% ‘String‘,‘${\bf w}_1^T{\bf x}+b_1=\epsilon$‘,...
% ‘Position‘,[0.740227905631546 -3.72444946357991 0]);
% case 2
% for k=j
% hold on
% decisionmapk = reshape(d(:,k), image_size);
% contour(x1,x2, decisionmapk, [contour_level0(1) contour_level0(1) ], color1{k},‘Fill‘,‘off‘,‘LineWidth‘,0.5,‘LineStyle‘,‘--‘);
% contour(x1,x2, decisionmapk, [contour_level(1) contour_level(1) ], color{k},‘Fill‘,‘off‘);
% contour(x1,x2, decisionmapk, [contour_level(2) contour_level(2) ], color{k},‘Fill‘,‘off‘,‘LineWidth‘,2);
% contour(x1,x2, decisionmapk, [contour_level(3) contour_level(3) ], color{k},‘Fill‘,‘off‘);
% contour(x1,x2, decisionmapk, [contour_level0(3) contour_level0(3) ], color1{k},‘Fill‘,‘off‘,‘LineWidth‘,0.5,‘LineStyle‘,‘--‘);
% end
% % Create text
% % Create text
% text(‘FontSize‘,14,‘Rotation‘,-38,‘Interpreter‘,‘latex‘,...
% ‘String‘,‘${\bf w}_2^T{\bf x}+b_2=0$‘,...
% ‘Position‘,[-6.75333555468633 5.93337097684923 0]);
%
% % Create text
% text(‘FontSize‘,14,‘Rotation‘,-38,‘Interpreter‘,‘latex‘,...
% ‘String‘,‘${\bf w}_2^T{\bf x}+b_2=-1$‘,...
% ‘Position‘,[-7.90663885146392 1.52907961603614 0]);
%
% % Create text
% text(‘FontSize‘,14,‘Rotation‘,-38,‘Interpreter‘,‘latex‘,...
% ‘String‘,‘${\bf w}_2^T{\bf x}+b_2=1$‘,...
% ‘Position‘,[-3.61623809040907 7.13043478260869 0]);
%
% % Create text
% text(‘FontSize‘,14,‘Rotation‘,-38,‘Interpreter‘,‘latex‘,...
% ‘String‘,‘${\bf w}_2^T{\bf x}+b_2=-\epsilon$‘,...
% ‘Position‘,[1.48862613754612 -3.98193111236589 0]);
%
% % Create text
% text(‘FontSize‘,14,‘Rotation‘,-38,‘Interpreter‘,‘latex‘,...
% ‘String‘,‘${\bf w}_2^T{\bf x}+b_2=\epsilon$‘,...
% ‘Position‘,[3.92151445533915 -1.07509881422926 0]);
%
% case 3
% for k=j
% hold on
% decisionmapk = reshape(d(:,k), image_size);
% contour(x1,x2, decisionmapk, [contour_level0(1) contour_level0(1) ], color1{k},‘Fill‘,‘off‘,‘LineWidth‘,0.5,‘LineStyle‘,‘--‘);
% contour(x1,x2, decisionmapk, [contour_level(1) contour_level(1) ], color{k},‘Fill‘,‘off‘);
% contour(x1,x2, decisionmapk, [contour_level(2) contour_level(2) ], color{k},‘Fill‘,‘off‘,‘LineWidth‘,2);
% contour(x1,x2, decisionmapk, [contour_level(3) contour_level(3) ], color{k},‘Fill‘,‘off‘);
% end
% % Create text
% text(‘FontSize‘,14,‘Rotation‘,-51,‘Interpreter‘,‘latex‘,...
% ‘String‘,‘${\bf w}_3^T{\bf x}+b_3=0$‘,...
% ‘Position‘,[4.52151824648326 3.02428006775833 0]);
%
% % Create text
% text(‘FontSize‘,14,‘Rotation‘,-51,‘Interpreter‘,‘latex‘,...
% ‘String‘,‘${\bf w}_3^T{\bf x}+b_3=-1$‘,...
% ‘Position‘,[-4.72535230175632 7.60700169395821 0]);
%
% % Create text
% text(‘FontSize‘,14,‘Rotation‘,-51,‘Interpreter‘,‘latex‘,...
% ‘String‘,‘${\bf w}_3^T{\bf x}+b_3=-\epsilon$‘,...
% ‘Position‘,[4.10850917848179 -1.02089215132693 0]);
%
% % Create text
% text(‘FontSize‘,14,‘Rotation‘,-51,‘Interpreter‘,‘latex‘,...
% ‘String‘,‘${\bf w}_3^T{\bf x}+b_3=\epsilon$‘,...
% ‘Position‘,[4.15543258399412 6.76905702992659 0]);
% end
% end
MATLAB画图,隐藏部分legends和使用带latex公式的标签例子
标签:ima mesh measure ack man oss false erp column
原文地址:http://www.cnblogs.com/huadongw/p/6413071.html