标签:-- ring 设备 director cat input 检查 add new 信息
目前官网更新特别快,不到半年时间就更新了好几个版本,目前最新的是5.1
以下安装配置使用4.5版本的
https://www.elastic.co/guide/en/kibana/4.5/index.html
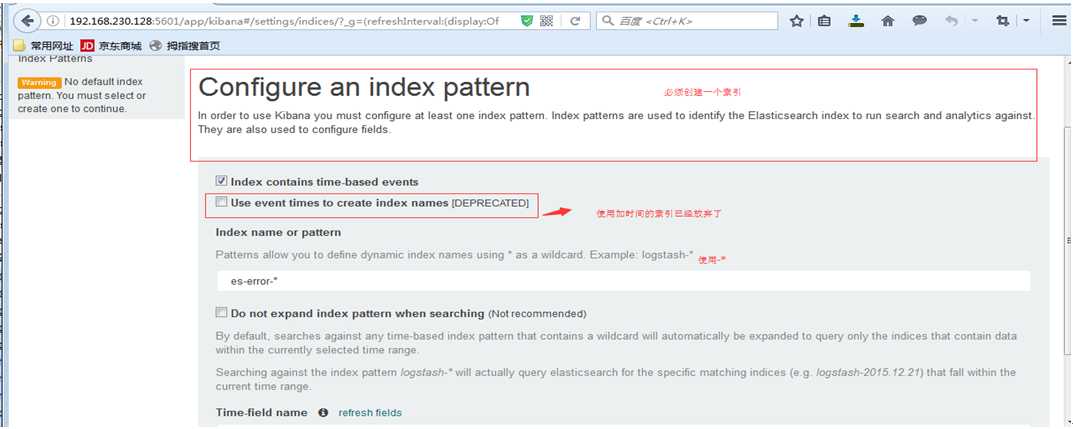
Installing Kibana with yum
#yum 安装Kibana
Warning #警告
The repositories set up in this procedure are not compatible with distributions using version 3 of rpm, such as CentOS version 5.
#如果你的系统是rpm版本3或者是centos 5的话存储库是不兼容的
1.Download and install the public signing key:
#下载并安装公共签名的密钥
rpm--import https://packages.elastic.co/GPG-KEY-elasticsearch

2.Create a file named kibana.repo in the /etc/yum.repos.d/ directory with the following contents:
#添加yum源在/etc/yum.repos.d/目录下名字命名为kibana.repo
[kibana-4.5]
name=Kibana repository for 4.5.x packages
baseurl=http://packages.elastic.co/kibana/4.5/centos
gpgcheck=1
gpgkey=http://packages.elastic.co/GPG-KEY-elasticsearch
enabled=1

3.Install Kibana by running the following command:
yum install kibana

Configure Kibana to automatically start during bootup. If your distribution is using the System V version of init (check with ps -p 1), run the following command:
#加入开机自启动,可以使用ps -p 1 查看,如果系统是使用版本init的,使用以下命令
chkconfig --add kibana

4. If your distribution is using systemd, run the following commands instead:
#如果你的发行版使用systemd,运行以下命令
sudo/bin/systemctl daemon-reload
sudo/bin/systemctl enable kibana.service

配置
[root@linux-node1 config]# grep "^[a-Z]" /opt/kibana/config/kibana.yml
server.port: 5601 #端口
server.host: "0.0.0.0" #允许访问主机,建议内网
elasticsearch.url: "http://192.168.230.128:9200" #es的地址
kibana.index: ".kibana"  #索引

systemctl start kibana #启动

netstat -ntpl|grep 5601 #检查
tcp        0      0 0.0.0.0:5601            0.0.0.0:*               LISTEN      6937/node

登陆IP加端口http://192.168.230.128:5601
创建索引
模式允许您使用*通配符定义动态索引名称。例子:logstash - *
下面是es-error-*
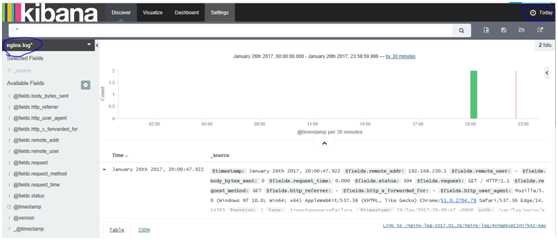
点击Discover【发现】默认是最后十五分钟,我们把它改为今天

现在我们点击开看到的事件是一个完整的
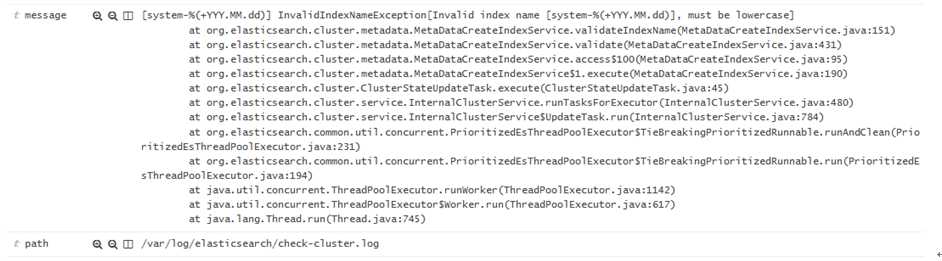
centos7系统库中默认是没有nginx的rpm包的,所以我们自己需要先更新下rpm依赖库
(1)使用yum安装nginx需要包括Nginx的库,安装Nginx的库
#rpm -Uvh http://nginx.org/packages/centos/7/noarch/RPMS/nginx-release-centos-7-0.el7.ngx.noarch.rpm
(2)使用下面命令安装nginx
#yum install nginx
(3)启动Nginx
#service nginx start
或
#systemctl start nginx.service

运行日志用json格式输出
#http段加如下信息(日志位置根据业务自行调整)

#nginx配置文件
[root@linux-node1 nginx]# cat nginx.conf

user  nginx;
worker_processes  1;

error_log  /var/log/nginx/error.log warn;
pid        /var/run/nginx.pid;


events {
    worker_connections  1024;
}


http {
    include       /etc/nginx/mime.types;
    default_type  application/octet-stream;

    log_format  main  ‘$remote_addr - $remote_user [$time_local] "$request" ‘
‘$status $body_bytes_sent "$http_referer" ‘
‘"$http_user_agent" "$http_x_forwarded_for"‘;
log_format json ‘{ "@timestamp": "$time_iso8601", ‘#在http段添加json格式的日志
‘"@version": "1",‘
‘"client": "$remote_addr", ‘
‘"url": "$uri", ‘
‘"status": "$status", ‘
‘"domain": "$host", ‘
‘"host": "$server_addr", ‘
‘"size": "$body_bytes_sent", ‘
‘"responsetime": "$request_time", ‘
‘"referer": "$http_referer",‘
‘"ua": "$http_user_agent"‘
‘}‘;
#access_log  /var/log/nginx/access.log  main;  #将原有的注释

    sendfile        on;
#tcp_nopush     on;

    keepalive_timeout  65;

#gzip  on;

    include /etc/nginx/conf.d/*.conf;
}

[root@linux-node1 conf.d]# cat default.conf
server {
    listen       80;
    server_name  localhost;

#charset koi8-r;
#access_log  /var/log/nginx/log/host.access.log  main; #注释原有的
   access_log  /var/log/nginx/access_json.log  json;#在server段添加日志格式
    location /{
        root   /usr/share/nginx/html;
        index  index.html index.htm;
}

#刷新nginx,就已经有日志了
[root@linux-node1 conf.d]# cd /var/log/nginx/
[root@linux-node1 nginx]# ls
access_json.log  access_json.log-20170210  error.log

#tail -f access_json.log 查看到的日志格式如下

{"@timestamp":"2017-02-11T09:53:38+08:00","@version":"1","client":"192.168.230.1","url":"/index.html","status":"304","domain":"192.168.230.128","host":"192.168.230.128","size":"0","responsetime":"0.000","referer":"-","ua":"Mozilla/5.0 (Windows NT 10.0; Win64; x64) AppleWebKit/537.36 (KHTML, like Gecko) Chrome/51.0.2704.79 Safari/537.36 Edge/14.14393"}

#检查并重新启动
[root@linux-node1 ~]# nginx -t
nginx: the configuration file /etc/nginx/nginx.conf syntax is ok
nginx: configuration file /etc/nginx/nginx.conf test is successful
[root@linux-node1 ~]# service nginx restart
Redirecting to /bin/systemctl restart  nginx.service


#先来测试一下
[root@linux-node1 ~]# cat json.conf
input {

file{
type=>"access_nginx"
        path =>"/var/log/nginx/access_json.log"
        codec =>"json"
}
}

output {
    stdout {
        codec=>"rubydebug"
}
}


#运行,刷新访问nginx的地址http://192.168.230.128 ,让其生成日志,然后屏幕有输出就表示正常
/opt/logstash/bin/logstash -f json.conf

[root@linux-node1 conf.d]# cat all.conf
input{
  syslog {
type=>"system-syslog"
    host =>"192.168.230.128"
    port =>"514"
}
file{#增加的内容
    path =>"/var/log/nginx/access_json.log"
    codec => json
    start_position =>"beginning"
type=>"nginx-log"
}

file{
     path =>"/var/log/messages"
type=>"system"
     start_position =>"beginning"
}
file{
     path =>"/var/log/elasticsearch/check-cluster.log"
type=>"es-error"
     start_position =>"beginning"
        codec => multiline {
           pattern =>"^\["
           negate => true
           what =>"previous"
}
}
}
output{
if[type]=="system"{
    elasticsearch {
        hosts =>["192.168.230.128:9200"]
        index =>"system-%{+YYY.MM.dd}"
}
}
if[type]=="es-error"{
        elasticsearch {
                hosts =>["192.168.230.128:9200"]
                index =>"es-error-%{+YYY.MM.dd}"

}
}
if[type]=="system-syslog"{
        elasticsearch {
                hosts =>["192.168.230.128:9200"]
                index =>"system-syslog-%{+YYY.MM.dd}"
}
}
if[type]=="nginx-log"{#增加的内容
        elasticsearch {
                hosts =>["192.168.230.128:9200"]
                index =>"nginx-log-%{+YYY.MM.dd}"

}
}
}
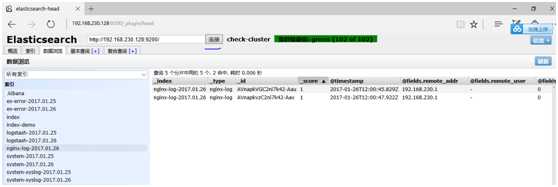
点击连接,数据浏览
Kibana上添加展示,点击Settings 添加
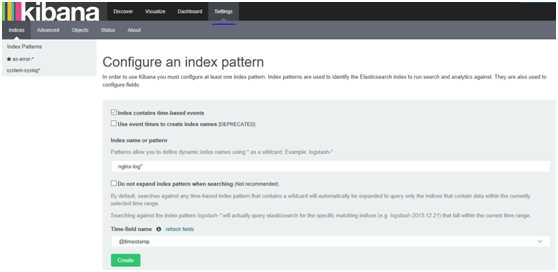
添加完再点击Discover 选择nginx-log* ,日期选择今天,也可以选择15分钟前
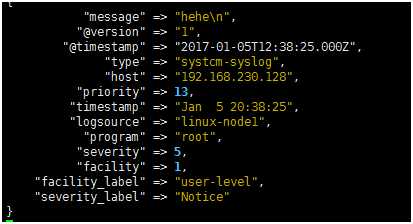
#Input plugins,输入插件,找到syslog
https://www.elastic.co/guide/en/logstash/2.3/input-plugins.html
系统日志,网络设备日志都可以收集
我们先来测试一下,工作环境我们是先测试好,然后整合到一个配置文件中
[root@linux-node1 ~]# cat syslog.conf
input {
 syslog {
type=>"systcm-syslog"
    host =>"192.168.230.128"
    port =>"514"
}

}
output {
 stdout {
    codec =>"rubydebug"
}

}
然后
/opt/logstash/bin/logstash  -f syslog.conf
[root@linux-node1 ~]# netstat -ntpl|grep514
tcp6       00192.168.230.128:514:::*                    LISTEN      2998/java

修改配置文件
/etc/rsyslog.conf文件

[root@linux-node1 ~]# tail -2/etc/rsyslog.conf
*.*@@192.168.230.128:514#所有日志,所有级别
# ### end of the forwarding rule ###
打开另一个窗口重启,那边就收到就对了
[root@linux-node1 ~]# systemctl restart rsyslog

打开另外一个窗口测试发送hehe
[root@linux-node1 ~]# logger "hehe"
查看显示如下,说明已经OK
测试完成我们再把它添加到all.conf文件中
[root@linux-node1 ~]# cat all.conf
input{
  syslog {  #添加的syslog
type=>"system-syslog"
    host =>"192.168.230.128"
    port =>"514"
}

file{
     path =>"/var/log/messages"
type=>"system"
     start_position =>"beginning"
}
file{
     path =>"/var/log/elasticsearch/check-cluster.log"
type=>"es-error"
     start_position =>"beginning"
        codec => multiline {
           pattern =>"^\["
           negate => true
           what =>"previous"
}
}
}
output{
if[type]=="system"{
    elasticsearch {
        hosts =>["192.168.230.128:9200"]
        index =>"system-%{+YYY.MM.dd}"
}
}
if[type]=="es-error"{
        elasticsearch {
                hosts =>["192.168.230.128:9200"]
                index =>"es-error-%{+YYY.MM.dd}"

}
}
if[type]=="system-syslog"{ #添加的system-syslog
        elasticsearch {
                hosts =>["192.168.230.128:9200"]
                index =>"system-syslog-%{+YYY.MM.dd}"
}
}
}
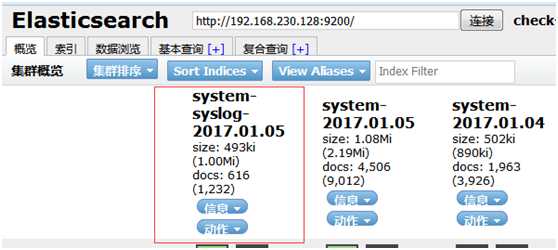
登录Elasticsearch
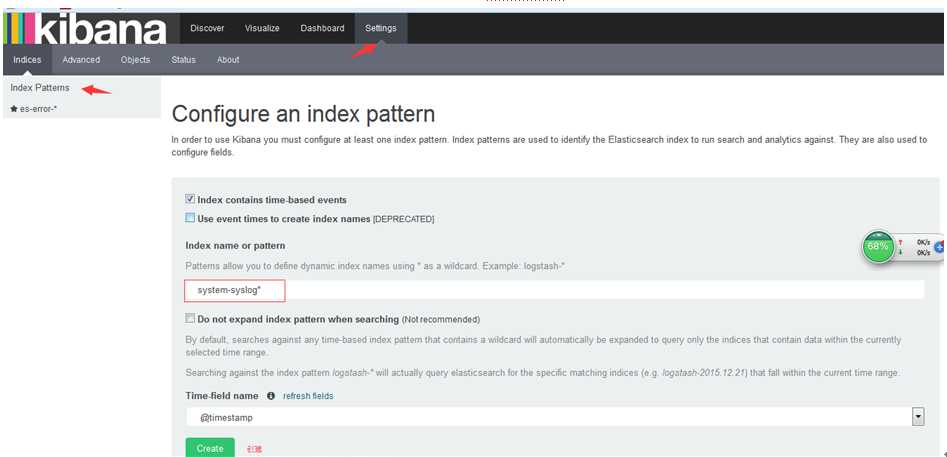
登录Kibana
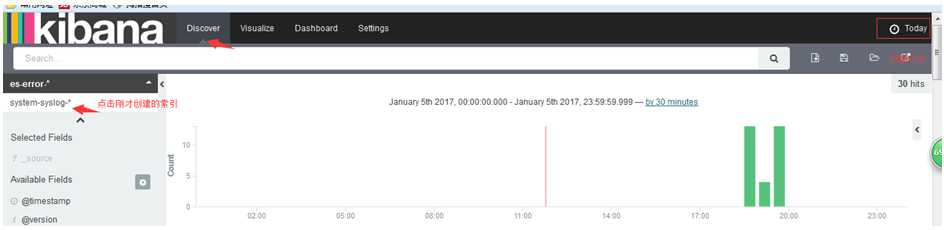
Settings -->+Add news添加索引system-syslog*然后create创建
点击Discover选择刚才创建的索引,日期选择Today
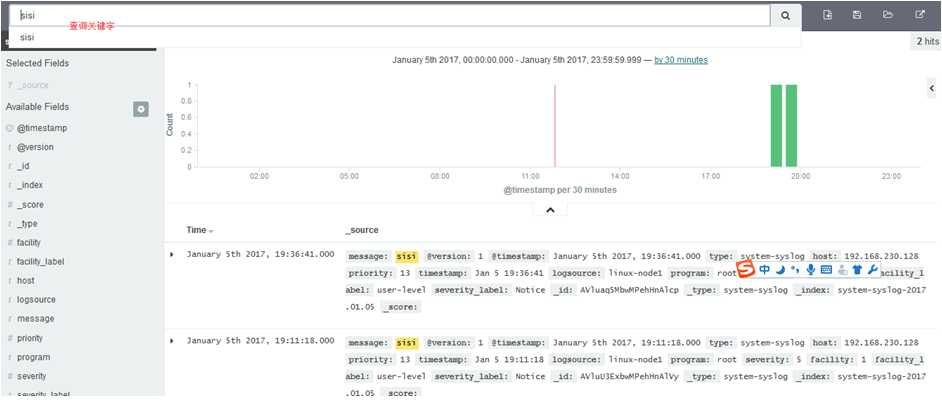
测试输入sisi
[root@linux-node1 ~]# logger "sisi"
[root@linux-node1 ~]# logger "sisi"
在Kibana中搜索关键字就可以找到
标签:-- ring 设备 director cat input 检查 add new 信息
原文地址:http://www.cnblogs.com/w787815/p/6676337.html