标签:tput mat frequency long sig des seconds highlight second

代码:
%% ------------------------------------------------------------------------
%% Output Info about this m-file
fprintf(‘\n***********************************************************\n‘);
fprintf(‘ <DSP using MATLAB> Exameple 8.4 \n\n‘);
time_stamp = datestr(now, 31);
[wkd1, wkd2] = weekday(today, ‘long‘);
fprintf(‘ Now is %20s, and it is %9s \n‘, time_stamp, wkd2);
%% ------------------------------------------------------------------------
Wp = 0.2*pi; Ws = 0.3*pi; Rp = 7; As =16;
Ripple = 10 ^ (-Rp/20); Attn = 10 ^ (-As/20);
% Analog filter design:
[b, a] = afd_butt(Wp, Ws, Rp, As);
% Calculation of second-order sections:
[C, B, A] = sdir2cas(b, a)
% Calculation of Frequency Response:
[db, mag, pha, ww] = freqs_m(b, a, 0.5*pi);
% Calculation of Impulse Response:
[ha, x, t] = impulse(b, a);
%% -------------------------------------------------
%% Plot
%% -------------------------------------------------
figure(‘NumberTitle‘, ‘off‘, ‘Name‘, ‘Exameple 8.4‘)
set(gcf,‘Color‘,‘white‘);
M = 0.5; % Omega max
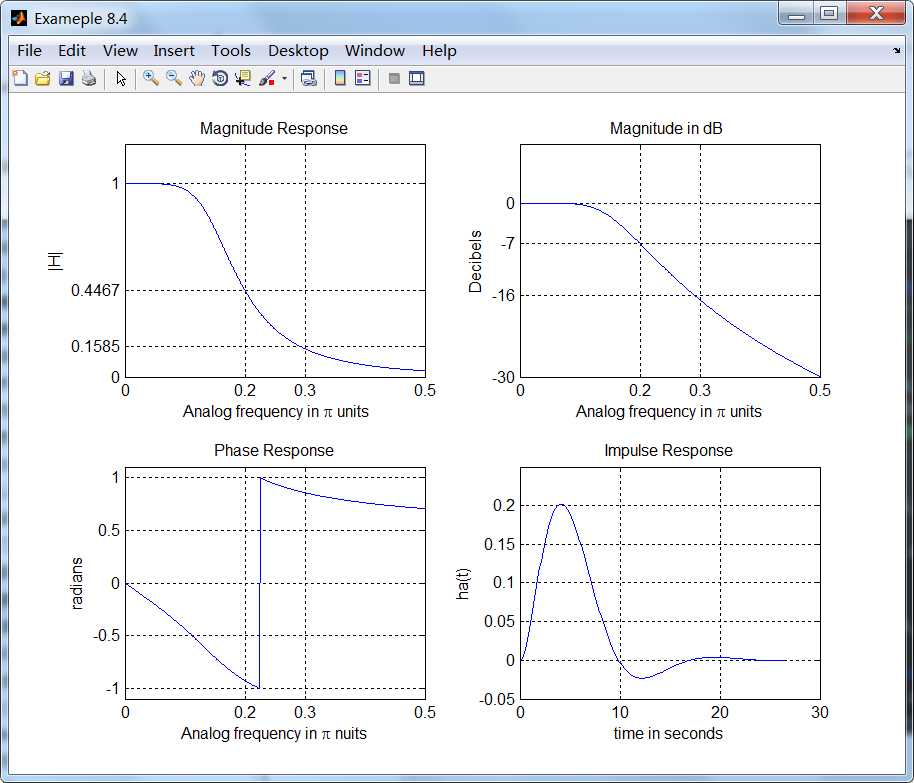
subplot(2,2,1); plot(ww/pi, mag); axis([0, M, 0, 1.2]); grid on;
xlabel(‘ Analog frequency in \pi units‘); ylabel(‘|H|‘); title(‘Magnitude Response‘);
set(gca, ‘XTickMode‘, ‘manual‘, ‘XTick‘, [0, 0.2, 0.3, M]);
set(gca, ‘YTickMode‘, ‘manual‘, ‘YTick‘, [0, 0.1585, 0.4467, 1]);
subplot(2,2,2); plot(ww/pi, db); axis([0, M, -30, 10]); grid on;
xlabel(‘Analog frequency in \pi units‘); ylabel(‘Decibels‘); title(‘Magnitude in dB ‘);
set(gca, ‘XTickMode‘, ‘manual‘, ‘XTick‘, [0, 0.2, 0.3, M]);
set(gca, ‘YTickMode‘, ‘manual‘, ‘YTick‘, [-30, -16, -7, 0]);
subplot(2,2,3); plot(ww/pi, pha/pi); axis([0, M, -1.1, 1.1]); grid on;
xlabel(‘Analog frequency in \pi nuits‘); ylabel(‘radians‘); title(‘Phase Response‘);
set(gca, ‘XTickMode‘, ‘manual‘, ‘XTick‘, [0, 0.2, 0.3, M]);
set(gca, ‘YTickMode‘, ‘manual‘, ‘YTick‘, [-1:0.5:1]);
subplot(2,2,4); plot(t, ha); axis([0, 30, -0.05, 0.25]); grid on;
xlabel(‘time in seconds‘); ylabel(‘ha(t)‘); title(‘Impulse Response‘);
运行结果:
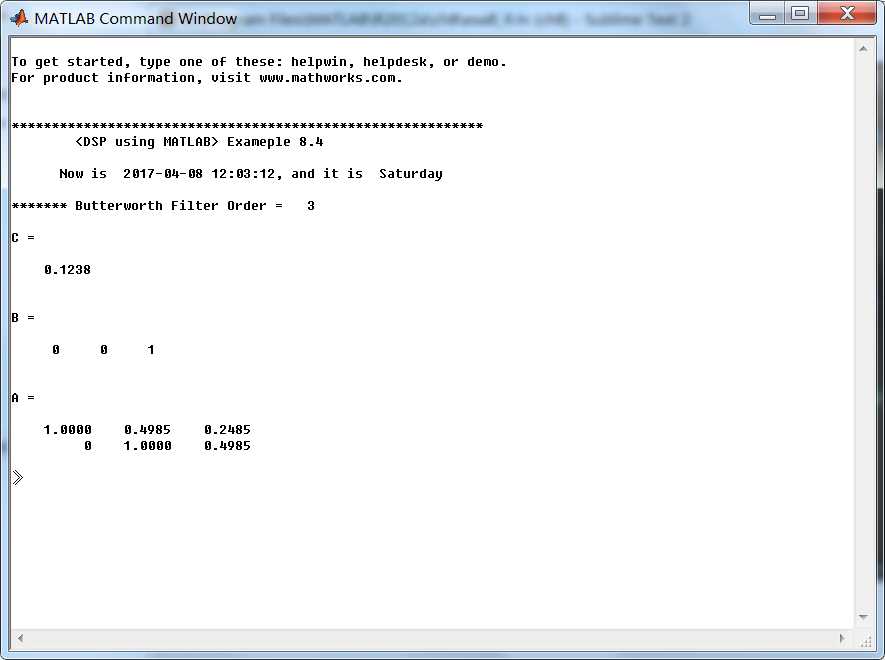
《DSP using MATLAB》示例Example 8.4
标签:tput mat frequency long sig des seconds highlight second
原文地址:http://www.cnblogs.com/ky027wh-sx/p/6687334.html