标签:注解 color else 不同 日志 src blog factor ati
最近我们的接口中有两个被调用的时候比较缓慢,一个查询大概需要2-3秒的样子,我们需要定位一下具体需要的时间秒数,就让某猿过去实现了。提交代码我review的时候我吓了一跳,那那两个类进行了手动统计时间,代码就不贴了,这样十分不好啊,如果以后要统计其他的controller或者service那就得手动再写,所以我重写了一份
我们需要对service以及controller进行统计,所以在springmvc.xml以及application-service.xml中都要开启aspectj 注解
<!-- 自动创建代理 对@AspectJ注解的支持 -->
    <!-- 通知spring使用cglib而不是jdk的来生成代理方法 AOP可以拦截到Controller -->
    <aop:aspectj-autoproxy proxy-target-class="true"></aop:aspectj-autoproxy>
在这里我们使用@Around通知来进行针对service的切面拦截,
@Aspect
@Component
public class LogServiceTakeTime {

    final static Logger log = LoggerFactory.getLogger(LogServiceTakeTime.class);

    @Pointcut("execution(* com.javasxy.service..*.*(..))")
//    @Pointcut("execution(* com.javasxy.web.controller.*.*(..))")
    public void performance(){
    }

    @Around("performance()")
    public Object doLog(ProceedingJoinPoint joinPoint) throws Throwable {

        //记录起始时间
        long begin = System.currentTimeMillis();
        Object result = "";
        /** 执行目标方法 */
        try{
            result= joinPoint.proceed();
        }
        catch(Exception e){
            log.error("日志记录发生错误, errorMessage: {}", e.getMessage());
        }
        finally{
            /** 记录操作时间 */
            long took = System.currentTimeMillis() - begin;
            if (took > 5000) {
                log.error("Service 执行时间为: {}毫秒", took);
//                log.error("Controller 执行时间为: {}毫秒", took);
            } else if (took > 2000) {
                log.warn("Service 执行时间为: {}毫秒", took);
//                log.warn("Controlle r执行时间为: {}毫秒", took);
            } else {
                log.info("Service执行时间为: {}毫秒", took);
//                log.info("Controller 执行时间为: {}毫秒", took);
            }
            // TODO 日志保存到MongoDB中
        }
        return result;
    }

}
这里就写的十分简单了,针对不同的耗时分别输出打印日志的类型
有部分朋友喜欢把数据保存到数据库中,其实我不推荐,最好是存入mongodb中即可,一来减少数据库压力,一来便于日后对日志进行分析统计以及报表制作。
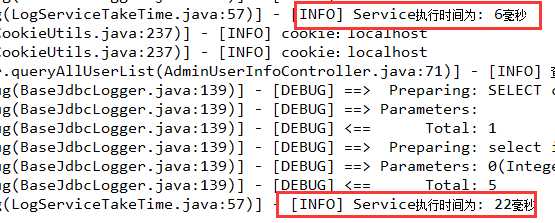
最后的输出是这样的
标签:注解 color else 不同 日志 src blog factor ati
原文地址:http://www.cnblogs.com/leechenxiang/p/6690318.html