标签:http 代码 images 设计 plot blog identity eve img
ggplot2工具箱
ggplot2的图层化架构让我们以一种结构化的方法来设计和构建图形,这里每一小节解决一个特定的作图问题。
1.基本图形类型
使用以下代码绘制几何对象:
> library(ggplot2)
> df <- data.frame(
+ x=c(3,1,5),
+ y=c(2,4,6),
+ lable=c("a","b","c")
+ )
> p <- ggplot(df,aes(x,y))+xlab(NULL)+ylab(NULL)
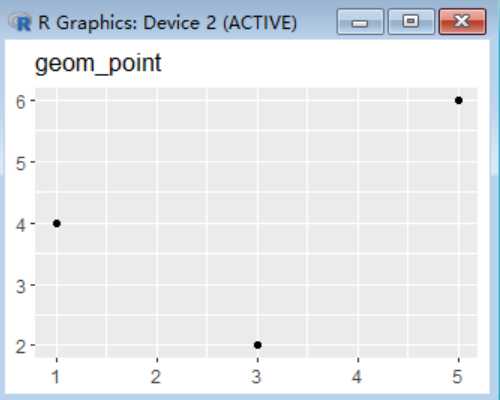
> p + geom_point()+labs(title="geom_point")
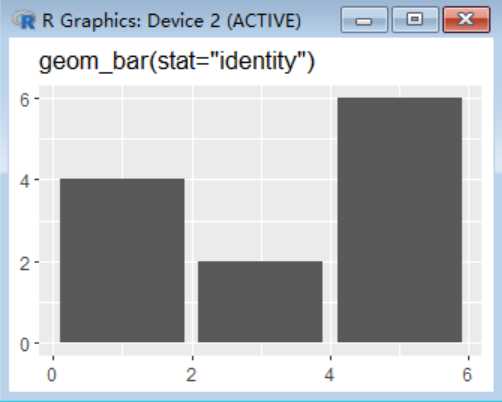
> p + geom_bar(stat="identity")+labs(title="geom_bar(stat=\"identity\")")
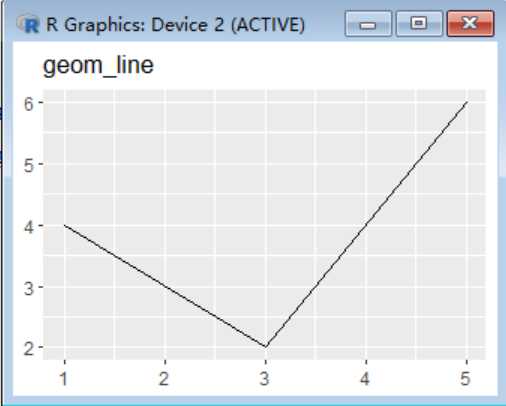
> p + geom_line() + labs(title="geom_line")
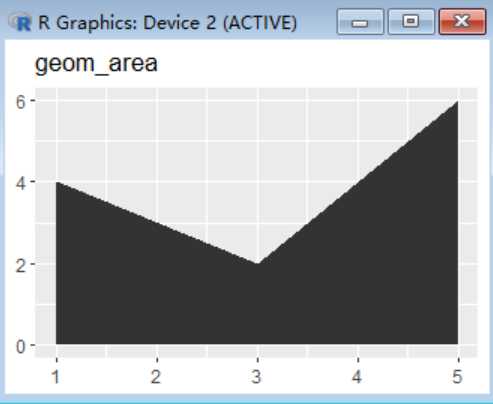
> p + geom_area()+labs(title="geom_area")
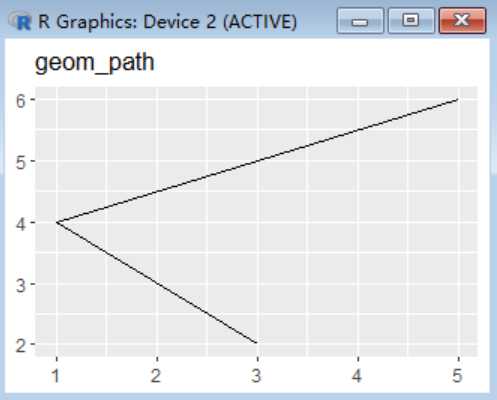
> p+ geom_path()+labs(title="geom_path")
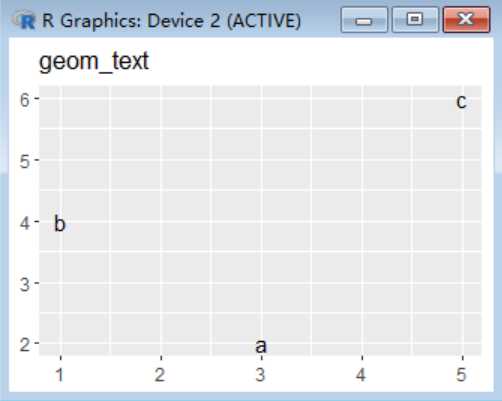
> p + geom_text(aes(label=lable))+labs(title="geom_text")
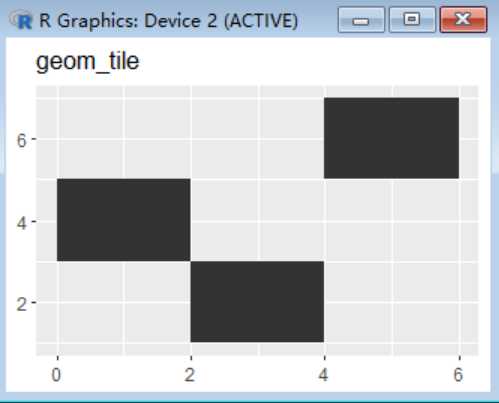
> p + geom_tile() + labs(title="geom_tile")
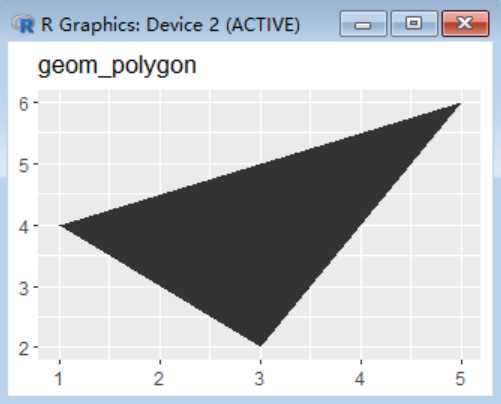
> p + geom_polygon() + labs(title="geom_polygon")
2.展示数据分布
标签:http 代码 images 设计 plot blog identity eve img
原文地址:http://www.cnblogs.com/lizhilei-123/p/6725588.html