标签:design amp output label hal pre manual tput grid

%% ------------------------------------------------------------------------
%%            Output Info about this m-file
fprintf(‘\n***********************************************************\n‘);
fprintf(‘        <DSP using MATLAB> Exameple 8.30 \n\n‘);

time_stamp = datestr(now, 31);
[wkd1, wkd2] = weekday(today, ‘long‘);
fprintf(‘      Now is %20s, and it is %8s  \n\n‘, time_stamp, wkd2);
%% ------------------------------------------------------------------------

% Digital Filter Specifications:   Chebyshev-2 bandpass
ws = [0.4*pi 0.7*pi];            % digital stopband freq in rad
wp = [0.25*pi 0.8*pi];           % digital passband freq in rad
Rp = 1;                          % passband ripple in dB
As = 40;                         % stopband attenuation in dB

% Calculation of Chebyshev-2 filter parameters:
[N, wn] = cheb2ord(wp/pi, ws/pi, Rp, As);

fprintf(‘\n  ********* Chebyshev-2 Filter Order is = %3.0f \n‘, N)

% Digital Elliptic Bandpass Filter Design:
[bhp, ahp] = cheby2(N, As, ws/pi, ‘stop‘);

[C, B, A] = dir2cas(bhp, ahp)

% Calculation of Frequency Response:
%[dblp, maglp, phalp, grdlp, wwlp] = freqz_m(blp, alp);
[dbhp, maghp, phahp, grdhp, wwhp] = freqz_m(bhp, ahp);


%% -----------------------------------------------------------------
%%                             Plot
%% -----------------------------------------------------------------

figure(‘NumberTitle‘, ‘off‘, ‘Name‘, ‘Exameple 8.30‘)
set(gcf,‘Color‘,‘white‘);
M = 1;                          % Omega max

subplot(2,2,1); plot(wwhp/pi, maghp); axis([0, M, 0, 1.2]); grid on;
xlabel(‘ frequency in \pi units‘); ylabel(‘|H|‘); title(‘Magnitude Response‘);
set(gca, ‘XTickMode‘, ‘manual‘, ‘XTick‘, [0, 0.25, 0.4, 0.7, 0.8, M]);
set(gca, ‘YTickMode‘, ‘manual‘, ‘YTick‘, [0, 0.8913, 1]);

subplot(2,2,2); plot(wwhp/pi, dbhp); axis([0, M, -50, 2]); grid on;
xlabel(‘ frequency in \pi units‘); ylabel(‘Decibels‘); title(‘Magnitude in dB‘);
set(gca, ‘XTickMode‘, ‘manual‘, ‘XTick‘, [0, 0.25, 0.4, 0.7, 0.8, M]);
set(gca, ‘YTickMode‘, ‘manual‘, ‘YTick‘, [-50, -40, -1, 0]);

subplot(2,2,3); plot(wwhp/pi, phahp/pi); axis([0, M, -1.1, 1.1]); grid on;
xlabel(‘frequency in \pi nuits‘); ylabel(‘radians in \pi units‘); title(‘Phase Response‘);
set(gca, ‘XTickMode‘, ‘manual‘, ‘XTick‘, [0, 0.25, 0.4, 0.7, 0.8, M]);
set(gca, ‘YTickMode‘, ‘manual‘, ‘YTick‘, [-1:0.5:1]);

subplot(2,2,4); plot(wwhp/pi, grdhp); axis([0, M, 0, 15]); grid on;
xlabel(‘frequency in \pi units‘); ylabel(‘Samples‘); title(‘Group Delay‘);
set(gca, ‘XTickMode‘, ‘manual‘, ‘XTick‘, [0, 0.25, 0.4, 0.7, 0.8, M]);
set(gca, ‘YTickMode‘, ‘manual‘, ‘YTick‘, [0:5:15]);
运行结果:
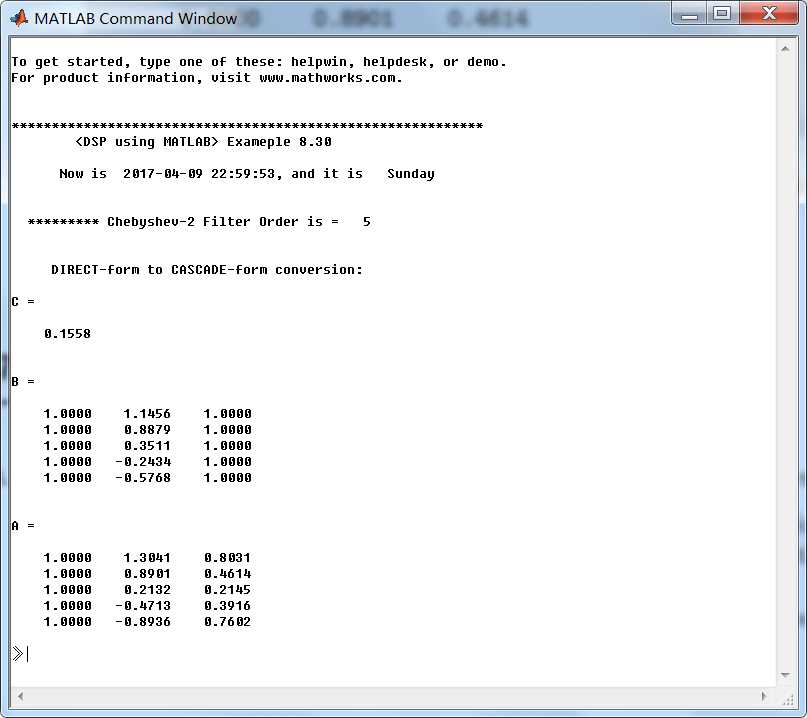
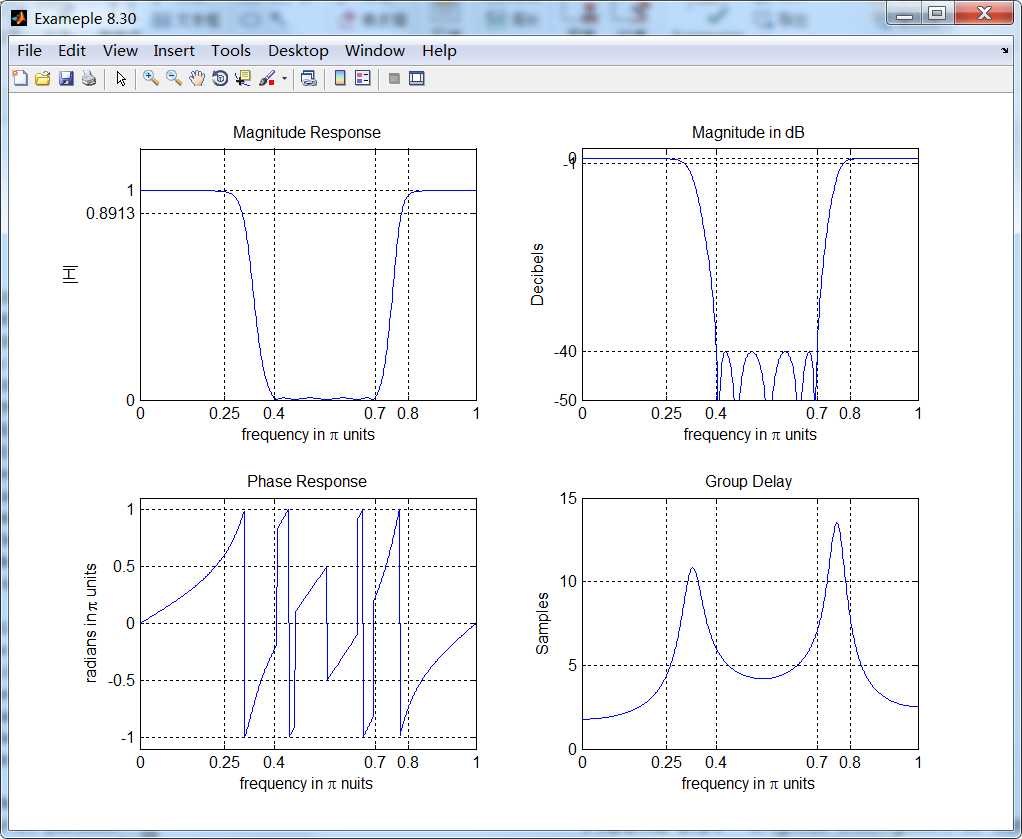
《DSP using MATLAB》示例Example 8.30
标签:design amp output label hal pre manual tput grid
原文地址:http://www.cnblogs.com/ky027wh-sx/p/6741727.html