标签:tar sim bsp and att nbsp plt class lod
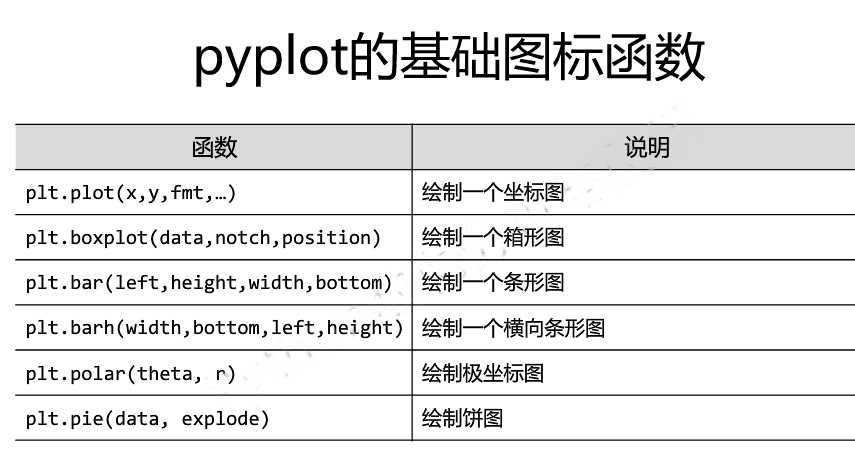
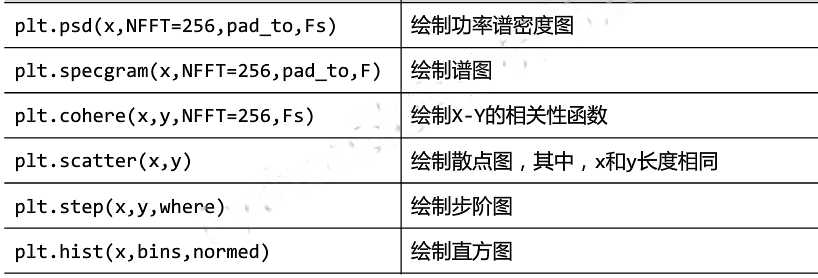

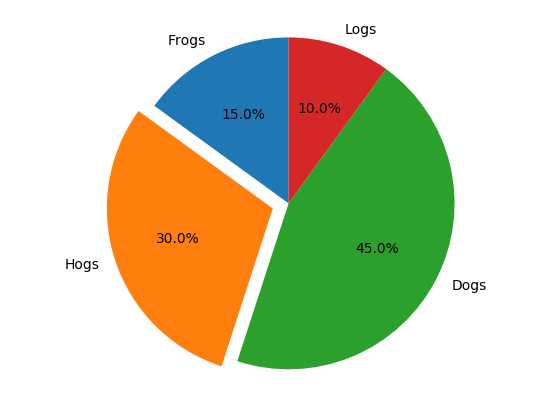
pyplot饼图的绘制
 1 import matplotlib.pyplot as plt
 2
 3 labels = ‘Frogs‘, ‘Hogs‘, ‘Dogs‘, ‘Logs‘
 4 sizes = [15, 30, 45, 10]
 5 explode = (0, 0.1, 0, 0)
 6
 7 plt.pie(sizes, explode=explode, labels=labels, autopct=‘%1.1f%%‘, shadow=False, startangle=90)
 8
 9 plt.axis(‘equal‘)
10 plt.show()
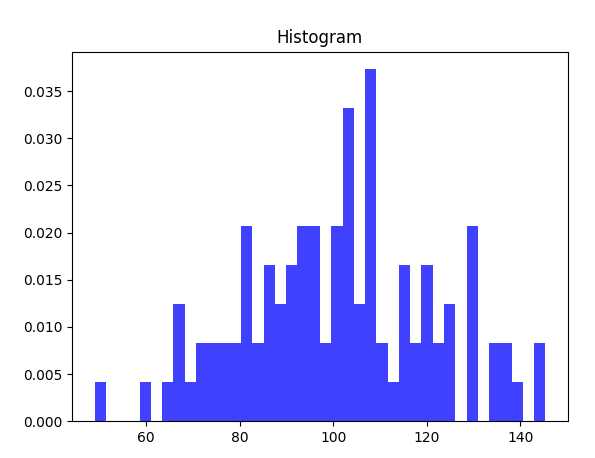
pyplot直方图的绘制
 1 import numpy as np
 2 import matplotlib.pyplot as plt
 3
 4 np.random.seed(0)
 5 mu, sigma = 100, 20
 6 a = np.random.normal(mu, sigma,size=100)
 7
 8 plt.hist(a, 40, normed=1, histtype=‘stepfilled‘, facecolor=‘b‘, alpha=0.75)
 9 plt.title(‘Histogram‘)
10
11 plt.show()
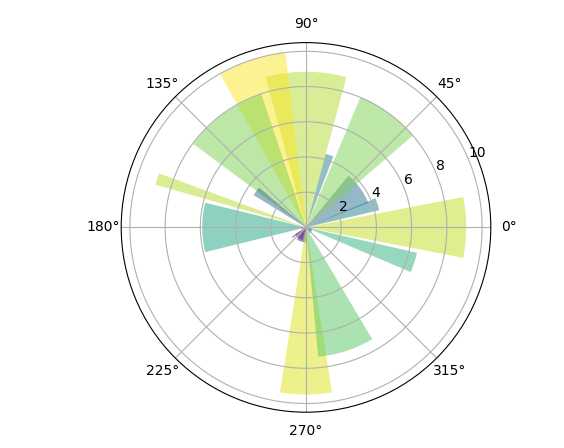
pyplot极坐标图的绘制
 1 import numpy as np
 2 import matplotlib.pyplot as plt
 3
 4 N = 20
 5 theta = np.linspace(0.0, 2*np.pi, N, endpoint=False)
 6 radii = 10*np.random.rand(N)
 7 width = np.pi / 4 * np.random.rand(N)
 8
 9 ax = plt.subplot(111,projection=‘polar‘)
10 bars = ax.bar(theta, radii, width=width, bottom=0.0)
11
12 for r, bar in zip(radii, bars):
13     bar.set_facecolor(plt.cm.viridis(r / 10.))
14     bar.set_alpha(0.5)
15
16 plt.show()
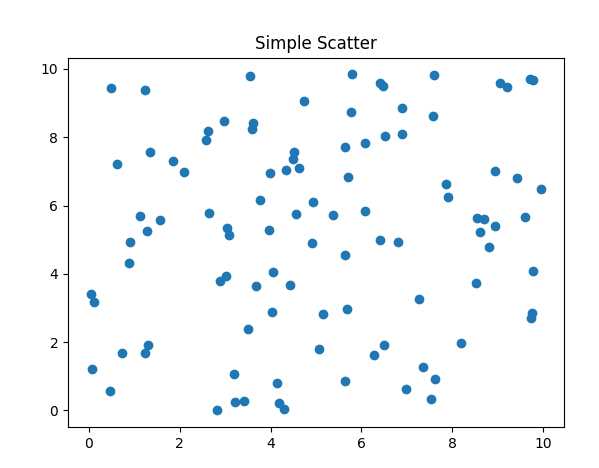
pyplot散点图的绘制
1 import numpy as np
2 import matplotlib.pyplot as plt
3
4 fig, ax = plt.subplots()
5 ax.plot(10*np.random.random(100),10*np.random.rand(100),‘o‘)
6 ax.set_title(‘Simple Scatter‘)
7
8 plt.show()
标签:tar sim bsp and att nbsp plt class lod
原文地址:http://www.cnblogs.com/xingkongyihao/p/6763356.html