标签:zed includes 无数据 setborder center tle null end nts
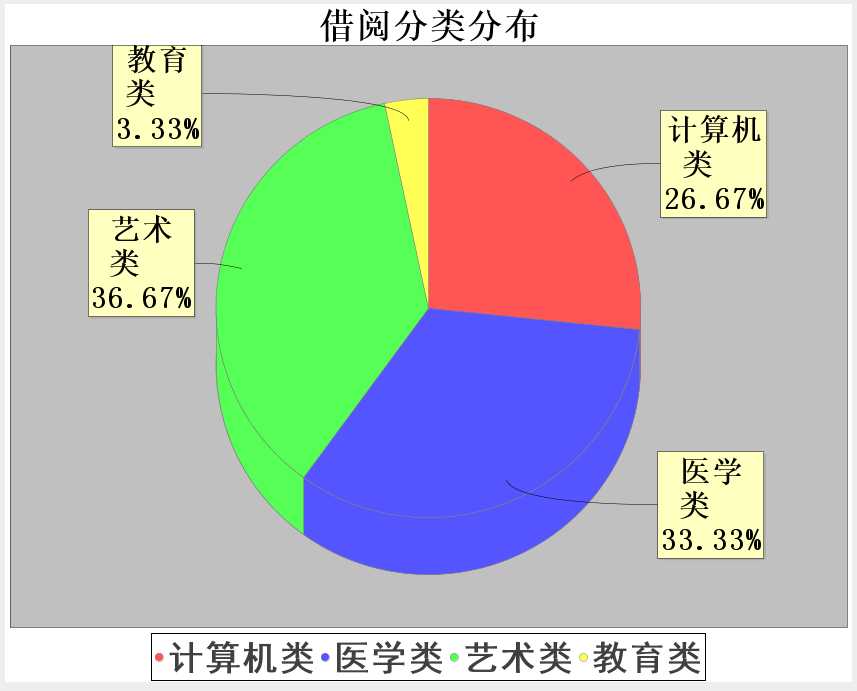
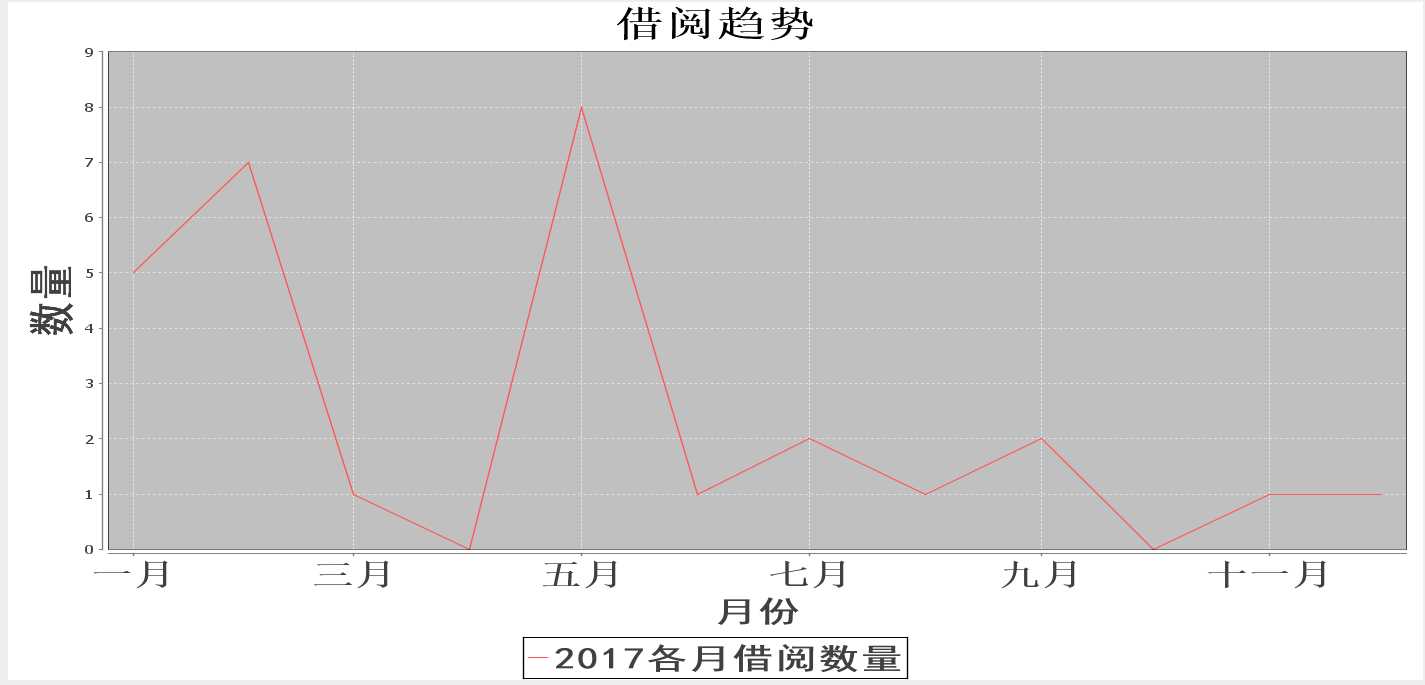
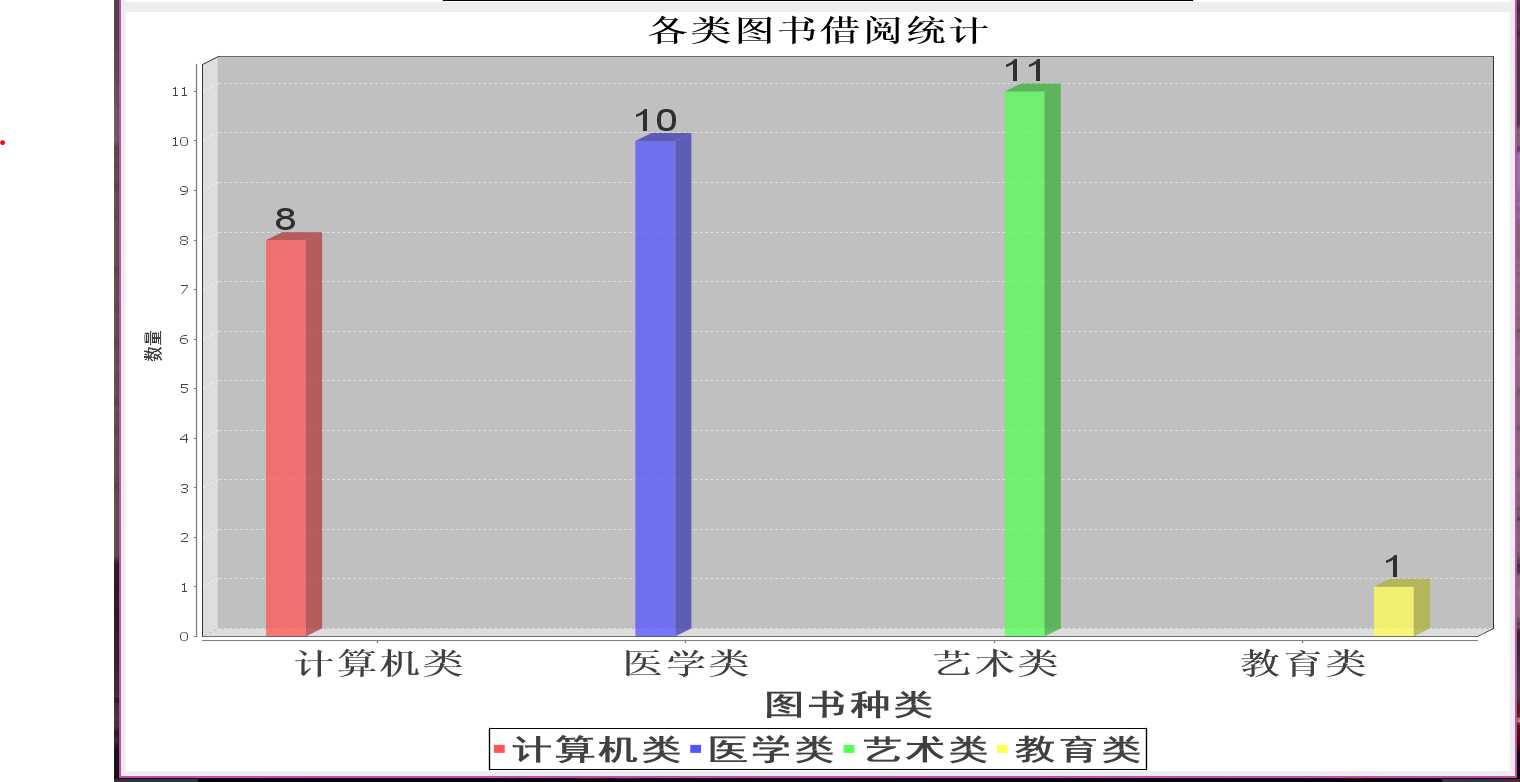
JAVA的JFreeChar提供了绘制各种与统计有关的图形,比如直方图,折线图,饼图等,而且有各种样式。这里只是应用了最简单的绘制,没有什么炫酷的修饰。
一、饼状图:

实现饼状图的类为
public class PieChart {
    ChartPanel frame1;

    public PieChart() {
        super();
        // TODO Auto-generated constructor stub
    }
    /**
     * 画出指定大小饼状图
     * @param v 表示图片大小
     * @param TypeBuffer 用来记录图书种类
     * @param number 用来记录每种图书对应的数量
     */
    public PieChart(Dimension v,StringBuffer[] TypeBuffer,int[] number)
    {
          DefaultPieDataset data = getDataSet(TypeBuffer,number);//数据集获得
          JFreeChart chart = ChartFactory.createPieChart3D(
                                       "借阅分类分布",//// 图表标题
                                        data,//数据集
                                         true,// 是否显示图例
                                         false,// 是否生成工具
                                          false// 是否生成URL链接
                                          );// 创建图表
        //设置百分比
          PiePlot pieplot = (PiePlot) chart.getPlot();
          DecimalFormat df = new DecimalFormat("0.00%");//获得一个DecimalFormat对象,主要是设置小数问题
          NumberFormat nf = NumberFormat.getNumberInstance();//获得一个NumberFormat对象
          StandardPieSectionLabelGenerator sp1 = new StandardPieSectionLabelGenerator("{0}  {2}", nf, df);//获得StandardPieSectionLabelGenerator对象
          pieplot.setLabelGenerator(sp1);//设置饼图显示百分比

      //没有数据的时候显示的内容
          pieplot.setNoDataMessage("无数据显示");
          pieplot.setCircular(false);
          pieplot.setLabelGap(0.02D);

          pieplot.setIgnoreNullValues(true);//设置不显示空值
          pieplot.setIgnoreZeroValues(true);//设置不显示负值
          frame1=new ChartPanel (chart,true);
          frame1.setPreferredSize(new Dimension(v));//设置大小
          chart.getTitle().setFont(new Font("宋体",Font.BOLD,35));//设置标题字体
          PiePlot piePlot= (PiePlot) chart.getPlot();//获取图表区域对象
          piePlot.setLabelFont(new Font("宋体",Font.BOLD,30));//解决乱码,设置标签的字体
          chart.getLegend().setItemFont(new Font("黑体",Font.BOLD,35));//设置下面图例字体
    }

    /**
     *生成与外界窗口一样大小图
     * @param TypeBuffer
     * @param number
     */
    public PieChart(StringBuffer[] TypeBuffer,int[] number)
    {
          DefaultPieDataset data = getDataSet(TypeBuffer,number);
          JFreeChart chart = ChartFactory.createPieChart3D("借阅分类分布",data,true,false,false);
        //设置百分比
          PiePlot pieplot = (PiePlot) chart.getPlot();
          DecimalFormat df = new DecimalFormat("0.00%");//获得一个DecimalFormat对象,主要是设置小数问题
          NumberFormat nf = NumberFormat.getNumberInstance();//获得一个NumberFormat对象
          StandardPieSectionLabelGenerator sp1 = new StandardPieSectionLabelGenerator("{0}  {2}", nf, df);//获得StandardPieSectionLabelGenerator对象
          pieplot.setLabelGenerator(sp1);//设置饼图显示百分比

      //没有数据的时候显示的内容
          pieplot.setNoDataMessage("无数据显示");
          pieplot.setCircular(false);
          pieplot.setLabelGap(0.02D);

          pieplot.setIgnoreNullValues(true);//设置不显示空值
          pieplot.setIgnoreZeroValues(true);//设置不显示负值
          frame1=new ChartPanel (chart,true);
          chart.getTitle().setFont(new Font("宋体",Font.BOLD,35));//设置标题字体
          PiePlot piePlot= (PiePlot) chart.getPlot();//获取图表区域对象
          piePlot.setLabelFont(new Font("宋体",Font.BOLD,30));//解决乱码
          chart.getLegend().setItemFont(new Font("黑体",Font.BOLD,35));
    }
    /**
     * 获得数据集
     * @param TypeBuffer
     * @param number
     * @return
     */
    private static DefaultPieDataset getDataSet(StringBuffer[] TypeBuffer,int[] number)
    {
        DefaultPieDataset dataset = new DefaultPieDataset();
        for(int i=0;i<TypeBuffer.length;++i)
        {
            if(StringUtil.isEmpty(TypeBuffer[i].toString()))//每个下标对应图书类别的主键,如果那个主键下没有记录,跳过
            {
                continue;
            }
            else
            {
                dataset.setValue(TypeBuffer[i].toString(),number[i]);//数据集来自图书种类名称和相应种类的借阅本数
            }
        }
        return dataset;
  }
    public ChartPanel getChartPanel(){
        return frame1;
    }
}
其中TypeBuffer和number获得方式就是扫描借阅记录的表格,将每条记录图书类别的主键作为这两个数组的下标,++即可:
/**
 * 借阅分布统计
 */
private void HisBorrowPieChart(StringBuffer[] TypeBuffer,int[] number)
{
    Connection con=null;
    try {
        con=dbUtil.getCon();
        Arrays.fill(number,0);//初始将所有类别本数置0
        for(int i=0;i<TypeBuffer.length;++i)
        {
             TypeBuffer[i]=new StringBuffer();//切记StringBuffer需要分配空间!这是与String最大不同
        }
        if(StringUtil.isEmpty(PresentUser))
        {
            Dialogutil attention=new Dialogutil(null,"Attention!","用户信息获取失败!");
            return;
        }
        else
        {
            //找到当前书和用户
            User user=new User(PresentUser);
            ResultSet Hisbo=borrowDao.HisBorrowDistri(con,user);//获取所有记录,由用户ID查找
            while( Hisbo.next()){
                int index=Hisbo.getInt("bt.id");//主键作为数组下标
                if(StringUtil.isEmpty(TypeBuffer[index].toString()))
                {                    TypeBuffer[index].append(Hisbo.getString("bt.bookTypeName"));
                }
                number[index]++;
            }
        }
    } catch (Exception e) {
        Dialogutil attention=new Dialogutil(null,"Attention!","用户信息获取失败!");
        e.printStackTrace();
    }
}
调用方式为:
HisBorrowPieChart(TypeBuffer,TypeNum);//更新数据集
PieChartJP.add(new PieChart(PieDi,TypeBuffer,TypeNum).getChartPanel());//添加饼状图 ,画在一个Jpanel容器中
二、折线图

public class TimeSeriesChart
{
    ChartPanel frame1;
/**
     * 折线图构造函数
     * @param v 折线图大小
     * @param BookMonthly 记录每个月本数,下标与月对应
     * @param CurrentYear  记录当前年份
     */
    public TimeSeriesChart(Dimension v,int []BookMonthly,int CurrentYear)
{
        XYDataset xydataset = createDataset(BookMonthly,CurrentYear);
        JFreeChart jfreechart = ChartFactory.createTimeSeriesChart("借阅趋势",//标题
                                                 "月份", //横坐标
                                                 "数量",//纵坐标
                                                  xydataset,//数据集
                                                   true,//有图例
                                                  true,//有工具集
                                                    true//统一资源定位图
                                                     );
        XYPlot xyplot = (XYPlot) jfreechart.getPlot();  // 获取绘图区对象
        DateAxis dateaxis = (DateAxis) xyplot.getDomainAxis();
        DecimalFormat df = new DecimalFormat("#0");//整数
        //y轴用整数表示
        ((NumberAxis) ((XYPlot)jfreechart.getPlot()).getRangeAxis()).setNumberFormatOverride(df);

        dateaxis.setDateFormatOverride(new SimpleDateFormat("MMM"));//横轴格式-yyyy

        frame1=new ChartPanel(jfreechart,true);
        frame1.setPreferredSize(new Dimension(v));//设置大小

        dateaxis.setLabelFont(new Font("黑体",Font.BOLD,30));         //水平底部标题
        dateaxis.setTickLabelFont(new Font("宋体",Font.BOLD,30));  //垂直标题
       // axis0.setLabelFont(new Font("黑体", Font.PLAIN, 12));// y轴字体
        ValueAxis rangeAxis=xyplot.getRangeAxis();//获取柱状
        rangeAxis.setLabelFont(new Font("黑体",Font.BOLD,35));
        jfreechart.getLegend().setItemFont(new Font("黑体", Font.BOLD, 30));
        //设定y在轴显示范围
       // NumberAxis domainAxis = (NumberAxis)xyplot.getDomainAxis();
        //纵轴从0开始
        //((NumberAxis)rangeAxis).setAutoRangeIncludesZero(true);
        rangeAxis.setLowerBound(0);
        //找最大值
         int max = BookMonthly[0];//定义变量
            for (int x=1; x<BookMonthly.length; x++ )
            {
                if (BookMonthly[x]>max)
                {
                    max = BookMonthly[x];
                }
            }
        rangeAxis.setUpperBound(max+1);//显示最大设为记录中最大值+1
     // 设置y轴不是使用自动刻度
        ((NumberAxis)rangeAxis).setAutoTickUnitSelection(false);
        // 设置刻度
        NumberTickUnit numberTickUnit = new NumberTickUnit(1);
        ((NumberAxis)rangeAxis).setTickUnit(numberTickUnit);
        jfreechart.getTitle().setFont(new Font("宋体",Font.BOLD,35));//设置标题字体

    }
     private static XYDataset createDataset(int []BookMonthly,int CurrentYear)
     {  //这个数据集有点多,但都不难理解
            TimeSeries timeseries = new TimeSeries(Integer.toString(CurrentYear)+"各月借阅数量",
                    org.jfree.data.time.Month.class);//时间轴精确到月
            timeseries.add(new Month(1,CurrentYear), BookMonthly[1]);//设置每个月数量
            timeseries.add(new Month(2,CurrentYear), BookMonthly[2]);
            timeseries.add(new Month(3,CurrentYear), BookMonthly[3]);
            timeseries.add(new Month(4,CurrentYear), BookMonthly[4]);
            timeseries.add(new Month(5,CurrentYear), BookMonthly[5]);
            timeseries.add(new Month(6,CurrentYear), BookMonthly[6]);
            timeseries.add(new Month(7,CurrentYear), BookMonthly[7]);
            timeseries.add(new Month(8,CurrentYear), BookMonthly[8]);
            timeseries.add(new Month(9,CurrentYear), BookMonthly[9]);
            timeseries.add(new Month(10,CurrentYear), BookMonthly[10]);
            timeseries.add(new Month(11,CurrentYear), BookMonthly[11]);
            timeseries.add(new Month(12,CurrentYear), BookMonthly[12]);
            TimeSeriesCollection timeseriescollection = new TimeSeriesCollection();
            timeseriescollection.addSeries(timeseries);
            return timeseriescollection;
        }
      public ChartPanel getChartPanel()
      {
            return frame1;
        }
}
数组BookMonthly对应值获得同样先连接数据库,扫描借阅表,取出其中的借阅日期,以月作为数组下标++即可:
//找到当前书和用户
            User user=new User(PresentUser);
            //获取当前时间
            java.sql.Date currentDate = new java.sql.Date(System.currentTimeMillis());
            DateInt curdate=new DateInt();
            DateUtil.getdate(currentDate, curdate);
            this.CurrentYear=curdate.getYear();
            ResultSet Hisbo=borrowDao.HisBorrowTrend(con,user);//获取所有记录,由用户ID查找
            while( Hisbo.next())
            {
                DateInt date=new DateInt();
                DateUtil.getdate(Hisbo.getDate("borTime"), date);
                if(curdate.getYear()==date.getYear())
                {
                    BookMonthly[date.getMonth()]++;//只统计当前年份
                }
                else
                {
                    continue;
                }
            }
使用折线图方式:
HisBorrowBrokenLine(BookMonthly);//更新数据集
BrokenLineJP.add(new TimeSeriesChart(Linetrend,BookMonthly,CurrentYear).getChartPanel()); //添加折线图
三、柱状图:

柱状图构造类实现方式:
public class BarChart {
      ChartPanel frame1;

      public BarChart() {
        super();
        // TODO Auto-generated constructor stub
    }

    /**
     * 柱状图构造函数
     * @param TypeBuffer 图书种类名称
     * @param number   图书种类对应数目
     */
    public  BarChart(StringBuffer[] TypeBuffer,int[] number)
      {
      CategoryDataset dataset = getDataSet(TypeBuffer,number);
      JFreeChart chart = ChartFactory.createBarChart3D( "各类图书借阅统计", // 图表标题
                                "图书种类", // 目录轴的显示标签
                                "数量", // 数值轴的显示标签
                                dataset, // 数据集
                                PlotOrientation.VERTICAL, // 图表方向:水平、垂直
                                true,           // 是否显示图例(对于简单的柱状图必须是false)
                                false,          // 是否生成工具
                                false           // 是否生成URL链接
                                );

         CategoryPlot plot=chart.getCategoryPlot();//获取图表区域对象
         CategoryAxis domainAxis=plot.getDomainAxis();         //水平底部列表
         domainAxis.setLabelFont(new Font("黑体",Font.BOLD,30));         //水平底部标题
         domainAxis.setTickLabelFont(new Font("宋体",Font.BOLD,30));  //垂直标题

         ValueAxis rangeAxis=plot.getRangeAxis();//获取柱状
         //设置刻度
         NumberTickUnit numberTickUnit = new NumberTickUnit(1);
         ((NumberAxis)rangeAxis).setTickUnit(numberTickUnit);
         //设置柱状图顶部数字
         BarRenderer3D renderer = (BarRenderer3D) plot.getRenderer(); //获得当前数据
         renderer.setBaseItemLabelGenerator(new StandardCategoryItemLabelGenerator()); //显示每个柱的数值

         renderer.setBaseItemLabelsVisible(true);
         renderer.setBaseItemLabelPaint(Color.BLACK);
         renderer.setBaseItemLabelFont(new Font("宋书",Font.PLAIN,30));
       //注意:此句很关键,若无此句,那数字的显示会被覆盖,给人数字没有显示出来的问题
         renderer.setBasePositiveItemLabelPosition(new ItemLabelPosition
                 (ItemLabelAnchor.OUTSIDE12,TextAnchor.BASELINE_CENTER ));//表示显示在上方,中间
         //ItemLabelAnchor.OUTSIDE3(显示在垂直方向中间), TextAnchor.BASELINE_RIGHT(显示在柱子右边)
         renderer.setItemLabelAnchorOffset(10D);// 设置柱形图上的文字偏离值
         rangeAxis.setLabelFont(new Font("黑体",Font.BOLD,15));
         chart.getLegend().setItemFont(new Font("黑体", Font.BOLD, 30));
         chart.getTitle().setFont(new Font("宋体",Font.BOLD,30));//设置标题字体
         //到这里结束,虽然代码有点多,但只为一个目的,解决汉字乱码问题
          frame1=new ChartPanel(chart,true);        //这里也可以用chartFrame,可以直接生成一个独立的Frame
        }

        /**
         * 获取数据
         * @return
         */
       private static CategoryDataset getDataSet(StringBuffer[] TypeBuffer,int[] number)
       {
           DefaultCategoryDataset dataset = new DefaultCategoryDataset();
           for(int i=0;i<TypeBuffer.length;++i)
            {
               if(StringUtil.isEmpty(TypeBuffer[i].toString()))
                {
                    continue;
                }
               else
               {
                   dataset.addValue(number[i],TypeBuffer[i].toString(),TypeBuffer[i].toString());
               }
            }

           return dataset;
}
    public ChartPanel getChartPanel()
    {
        return frame1;

    }
}
数据集和饼状图一样。但这里显示时候是管理员图书统计按钮下单独开的一个JFrame窗口,与饼状图一起上下排列显示:
public class Statistic extends JFrame {

    private JPanel contentPane;
     //设置跟随分辨率变化窗口
    Toolkit kit = Toolkit.getDefaultToolkit();
    Dimension screenSize = kit.getScreenSize();
    private int screenHeight = (int) screenSize.getHeight();
    private int screenWidth = (int) screenSize.getWidth();
    private double enlargement_x=screenWidth/1920;
    private double enlargement_y=screenHeight/1080;
    private int windowWidth ; //获得窗口宽
    private int windowHeight; //获得窗口高
    /*******************统计变量***************************************/
    final private int typenum=50;//用于存放有多少图书种类
       int []TypeNum=new int[typenum];
    StringBuffer[] TypeBuffer=new StringBuffer[typenum];//记录各类书数量
    int []BookMonthly=new int[13];//统计各月借阅数量,下标与月份对齐
    int CurrentYear;//当前年份,用于折线图数据
    /**************************数据库操作****************************************/
    DbUtil dbUtil=new DbUtil();//数据库连接类
    BorrowDao borrowDao=new BorrowDao();//借阅表类
    /**
     * Launch the application.
     */
    public static void main(String[] args) {
        EventQueue.invokeLater(new Runnable() {
            @Override
            public void run() {
                try {
                    Statistic frame = new Statistic();
                    frame.setVisible(true);
                } catch (Exception e) {
                    e.printStackTrace();
                }
            }
        });
    }

    /**
     * Create the frame.
     */
    public Statistic()
    {
        setResizable(false);
        setTitle("\u6570\u636E\u7EDF\u8BA1\u56FE");
        setDefaultCloseOperation(WindowConstants.DISPOSE_ON_CLOSE);
        setBounds(screenWidth * 2/7, screenHeight / 3, (int)(1400*enlargement_x),(int)(1600*enlargement_y));
        windowWidth = this.getWidth(); //获得窗口宽
        windowHeight = this.getHeight(); //获得窗口高
        this.setLocation(screenWidth / 2 - windowWidth / 2, screenHeight / 2 - windowHeight / 2);//设置窗口居中显示
        contentPane = new JPanel();
        contentPane.setBorder(new EmptyBorder(5, 5, 5, 5));
        setContentPane(contentPane);
        contentPane.setLayout(new GridLayout(2,1,10,10));
         //Dimension PieDi=new Dimension(50,80);
        HisBorrowPieChart(TypeBuffer,TypeNum);//获得数据
        contentPane.add(new PieChart(TypeBuffer,TypeNum).getChartPanel());           //添加饼状图
        contentPane.add(new BarChart(TypeBuffer,TypeNum).getChartPanel());//添加柱形图
        //设置JFrame最大化
        //this.setExtendedState(JFrame.MAXIMIZED_BOTH);
    }

}
标签:zed includes 无数据 setborder center tle null end nts
原文地址:http://www.cnblogs.com/satire/p/6851874.html