标签:并且 engine adl vim ima 解析 pen 常用 clu
1. 什么是graph visualization?
Graph visualization is a way of representing structural information as diagrams of abstract graphs and networks. It has important applications in networking, bioinformatics, software engineering, database and web design, machine learning, and in visual interfaces for other technical domains.
Graphviz is open source graph visualization software. It has several main layout programs. See the gallery for sample layouts.
2. 怎样安装graph visualization?
我的测试系统安装:sudo apt-get install graphviz
3. graph visulzation 的layout?
dot ? filter for drawing directed graphs
neato ? filter for drawing undirected graphs
twopi ? filter for radial layouts of graphs
circo ? filter for circular layout of graphs
fdp ? filter for drawing undirected graphs
sfdp ? filter for drawing large undirected graphs
patchwork ? filter for squarified tree maps
osage ? filter for array-based layouts
graphviz是贝尔实验室开发的一个开源的工具包,它使用一个特定的DSL(领域特定语言)——Dot作为脚本语言,然后使用布局引擎解析脚本并完成自动布局。Graphviz的设计初衷是对图进行自动布局(有向图、无向图、),可以使用dot脚本来定义图形元素,选择一定的算法进行布局,通过对输入脚本的解析,分析出其中的点,边以及子图,然后根据属性进行绘制,继而将结果以自己需要的格式导出来。
dot语言的定义:(http://www.graphviz.org/content/dot-language)
这里我只介绍一下常用的:
1. dot---基本语法
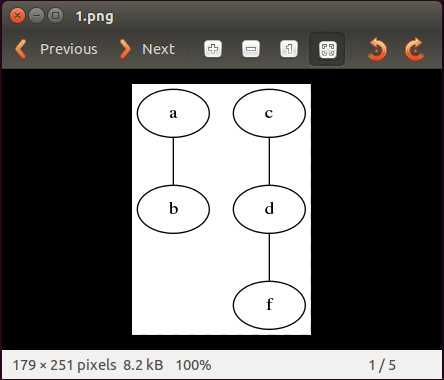
graph(无向图)表示图,然后{}中的内容是对图的描述,注释风格和C类似(“//”用于单行注释,/**/用于多行注释)。如一个无向图
graph graph1
{
	a -- b
	c -- d
	d -- f
}
执行 dot -Tpng -o 1.png 1.dot 后 xdg-open 1.png 显示图片

2.dot---节点
DOT中,节点可以不用声明直接使用。每个节点首次出现的名称做为该节点的唯一标识。
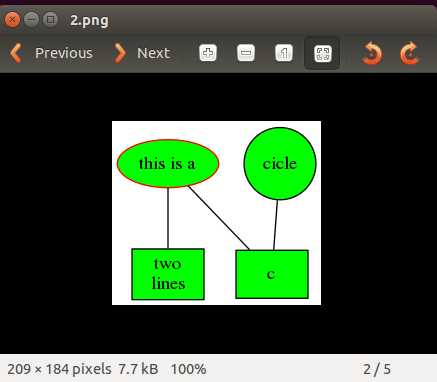
属性设置:对节点可以设置的常见通用属性有shape、label、style、color、fillcolor、rank等,对于不同的形状,可能还有不同的属性可以设置,如对于多边形可以设置边数等。节点属性设置时,node用于设置默认属性(对设置位置之后的点有效),在点后面用[]设置单独一个点的属性。
 1 graph node_setting{
 2     node [shape = "box", style = "filled", color = "black", fillcolor = "green"]//设置节点的默认形状,类型,颜色,填充颜色
 3
 4     a [shape = "ellipse", color = "red", label = "this is a"]//设置节点a的颜色,注意默认节点类型是filled,所以这里的color只是设置a的边框颜色
 5     b [label = "two\nlines"]   //label支持‘\n‘换行
 6     a -- b
 7     a -- c     //如果不需要设置c的属性,可以不用声明c而直接使用
 8
 9     node [shape = "circle"]
10     d [label = "cicle"]
11     c -- d      //d使用之前最后出现的node设置,形状为circle
12     {rank = same a, d}     //设置a和d在同一层
13
14 }
执行 dot -Tpng -o 2.png 2.dot 后 xdg-open 2.png 显示图片

3.dot --- 边
边有有向边和无向边两种,无向边用于无向图,有向边用于有向图,不可混用。
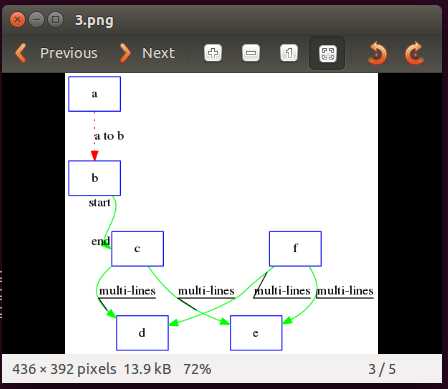
属性设置:边的常见设置有style、color、weight、label、labelfontcolor、headlabel、taillabel、decorate等,对于有向边,还可以设置边的起点位置等(用n、e、s、w和相邻字母的组合表示位置)。和节点类似的,边属性设置时,用edge[]设置默认属性,在边之后用[]设置单独一条边的属性。
 1 digraph edge_settings{
 2     edge [color = "green", decorate = false]        //设置边的默认属性
 3     node [shape = "polygon", sides = 4, color = "blue"]
 4     a -> b [style = "dotted", color = "red", label = "a to b"]  //设置style、color、label
 5     b: se -> c: w [headlabel = "end",  taillabel = "start"]     //设置边从b的“东南方”出发,从c的“西方”结束,设置有向边起点和重点的label
 6
 7     edge [style = "bond", decorate = true]      //设置之后的边加粗并且标签和连线之间有线标注
 8     //c -> d
 9     {c, f} -> {d, e} [label = "multi-lines"]    //可以用这种方式同时画多条边
10
11 }
执行 dot -Tpng -o 3.png 3.dot 后 xdg-open 3.png 显示图片

4.dot ---有向图
从前面的例子中已经可以看出,DOT语言可以描述无向图和有向图两种图,graph标识无向图,digraph标识有向图。
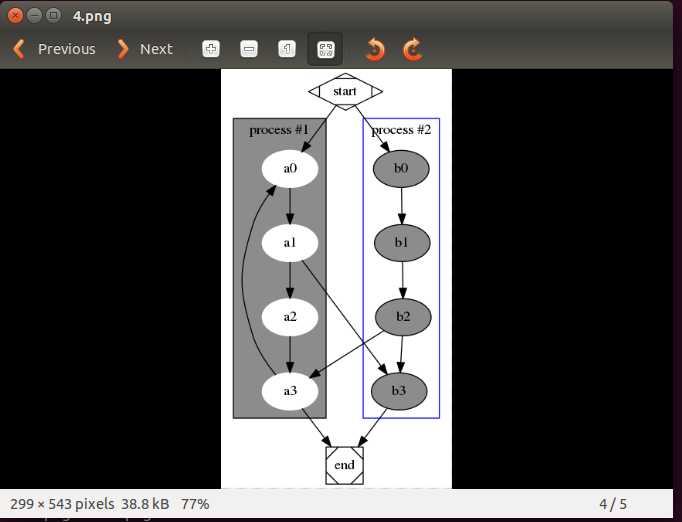
属性设置:在一个图的开头写入属性即可设置图形的属性,常用的图形属性有size、label、labelloc、labeljust、bgcolor、rankdir等。
子图,可以进行和“父图”类似的设置,唯一注意的是子图必须以"cluster"做为名称的开始。
 1 digraph graph_settings {
 2     start [shape = "Mdiamond"]
 3         end [shape = "Msquare"]
 4
 5         subgraph cluster_sub1 {
 6             label = "process #1"
 7                 labelloc = "t"
 8                 bgcolor = "gray55"
 9                 node [style = "filled", color = "white"]
10                 a0 -> a1 -> a2 -> a3 -> a0
11         }
12     subgraph cluster_sub2 {
13         label = "process #2"
14             labelloc = "t"
15             color = "blue"
16             node [style = "filled", color = "black", fillcolor = "gray55"]
17             b0 -> b1 -> b2 -> b3
18     }
19
20     start -> {a0, b0}
21     a1 -> b3
22         b2 -> a3
23         {a3, b3} -> end
24 }
执行 dot -Tpng -o 4.png 4.dot 后 xdg-open 4.png 显示图片

上面的4个例子中都是写完.dot脚本后,执行dot命令才生成图片显示。
那么,有没有工具能让写脚本的同时就能看到图形呢?of course!!!
vimdot
其实graph visualization 官网中介绍了很多的工具,就需要自己一个去试着玩玩,找到适合自己咯
标签:并且 engine adl vim ima 解析 pen 常用 clu
原文地址:http://www.cnblogs.com/black-mamba/p/7051083.html