标签:运算 分享 imshow int sdn 设置 his 灰度 显示
内容:颜色空间转换(BGR<->Gray、BGR<->HSV)/获取图形中特定颜色的物体/
函数:cv2.cvtColor(input_img,flag):flag:转换类型:cv2.COLOR_BGR2GRAY,cv2.COLOR_BGR2HSV等有261多种
|
import cv2 as cv import numpy as np #打印出所有的转换类型 flags = [item for item in dir(cv) if ‘COLOR_‘ in item] print(flags)
|
HSV:色度、饱和度、亮度
Gray:灰度图
BGR:B/G/R三通道图
算法:
|
import cv2 as cv import numpy as np
cap = cv.VideoCapture(0)#打开摄像头
while(1):#循环追踪每一帧 ret,frame = cap.read()#获取一帧 hsv = cv.cvtColor(frame,cv.COLOR_BGR2HSV)#BGR->HSV #设定指定的颜色阀值:蓝色/或者其他,你要追踪的目标的颜色 lower_blue = np.array([110,50,50]) uper_blue = np.array([130,255,255]) #根据阀值构建掩摸 mask = cv.inRange(hsv,lower_blue,uper_blue) #对比原图和掩模进行位运算 res = cv.bitwise_and(frame,frame,mask = mask) #显示图片
cv.namedWindow(‘IMG-FRAME‘) cv.imshow(‘IMG-FRAME‘, frame)
cv.namedWindow(‘IMG-MASK‘) cv.imshow(‘IMG-RES‘, mask)
cv.namedWindow(‘IMG-RES‘) cv.imshow(‘IMG-RES‘, res)
key = cv.waitKey(0)&0xff if key == 27:break
cv.destroyAllWindows()
|
|
###如果没有摄像头,直接对一张图片进行对指定颜色进行跟踪定位 import cv2 as cv import numpy as np
#cap = cv.VideoCapture(0)#打开摄像头
#while(1):#循环追踪每一帧
frame = cv.imread(‘E:\\fruits.jpg‘)#cap.read()获取一帧
hsv = cv.cvtColor(frame,cv.COLOR_BGR2HSV)#BGR->HSV #设定指定的颜色阀值:蓝色/或者其他,你要追踪的目标的颜色 lower_blue = np.array([110,50,50]) uper_blue = np.array([130,255,255]) #根据阀值构建掩摸 mask = cv.inRange(hsv,lower_blue,uper_blue) #对比原图和掩模进行位运算 res = cv.bitwise_and(frame,frame,mask = mask) #显示图片
cv.namedWindow(‘IMG-FRAME‘) cv.imshow(‘IMG-FRAME‘, frame)
cv.namedWindow(‘IMG-MASK‘) cv.imshow(‘IMG-RES‘, mask)
cv.namedWindow(‘IMG-RES‘) cv.imshow(‘IMG-RES‘, res)
key = cv.waitKey(0)&0xff if key == 27:input()
cv.destroyAllWindows() |
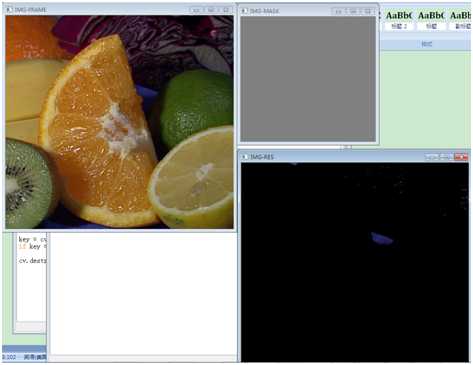
|
问题1:追踪的目标仍有些噪音,应该优化消减噪音
问题2:如何找到我要跟踪的目标的HSV值呢?
解决方法:将你的目标图的BGR值,通过颜色空间转换即可。例如绿色
|
import numpy as np import cv2 as cv ##green = np.uint8([0,255,0])###转换失败,因为数据类型不一致 green = np.uint8([[[0,255,0]]]) hsv_green = cv.cvtColor(green,cv.COLOR_BGR2HSV)#BGR->HSV print(hsv_green) |
参考http://opencv.jp/opencv-2.2_org/py/imgproc_geometric_image_transformations.html
原理:: \texttt{dst} \rightarrow \texttt{src}" v:shapes="_x0000_i1031">
内容:移动、旋转、仿射、扩展放缩
函数:cv2.getPerspectiveTransform 透视转换
cv2.warpAffine 变形-仿射 参数为2X3矩阵
cv2.warpPerspective 变形-透视 参数为3X3矩阵
cv2. getRotationMatrix2D 旋转
·放缩
|
import numpy as np import cv2 as cv
img = cv.imread(‘E:\\fruits.jpg‘)
height,width = img.shape[:2]
res = cv.resize(img,(1*width,1*height),interpolation=cv.INTER_AREA)
cv.imshow(‘res‘,res) ##cv.imshow(‘img‘,img)
cv.waitKey(0) cv.destroyAllWindows() |
·平移
|
import numpy as np import cv2 as cv
img = cv.imread(‘E:\\fruits.jpg‘)
rows,cols = img.shape[:2] M = np.float32([[1,0,100],[0,1,50]]) dst = cv.warpAffine(img,M,(cols,rows))
cv.imshow(‘img‘,dst) cv.waitKey(0) cv.destroyAllWindows() |
·旋转
|
import numpy as np import cv2 as cv
img = cv.imread(‘E:\\fruits.jpg‘)
rows,cols = img.shape[:2]
M = cv.getRotationMatrix2D((rows/2,cols/2),90,1)
dst = cv.warpAffine(img,M,(rows,cols))
cv.imshow(‘res‘,dst) ##cv.imshow(‘img‘,img)
cv.waitKey(0) cv.destroyAllWindows() |
·仿射变换warpAffine
对指定的三点,重新给出变形后的位置,得出新图像,原理:T = M X 求出X后应用到整个图片
可以平移、旋转、放大缩小等变形操作,只要给出变形前的三点与变形后的三点即可
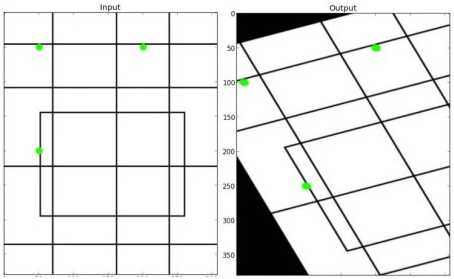
参考:http://blog.csdn.net/qq_18343569/article/details/47953505
|
import numpy as np import cv2 as cv from matplotlib import pyplot as plt
img = cv.imread(‘E:\\fruits.jpg‘) rows,cols = img.shape[:2]
pts1 = np.float32([[50,50],[200,50],[50,200]]) pts2 = np.float32([[10,10],[50,5],[10,200]])
M = cv.getAffineTransform(pts1,pts2)
dst = cv.warpAffine(img,M,(rows,cols))
cv.imshow(‘res‘,dst) ##cv.imshow(‘img‘,img)
cv.waitKey(0) cv.destroyAllWindows() |
·透视变换 warpPerspective
投影映射
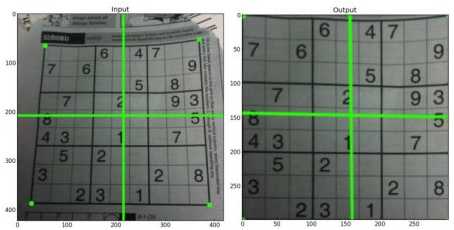
参考http://blog.csdn.net/qq_18343569/article/details/47953843
|
import numpy as np import cv2 as cv from matplotlib import pyplot as plt
img = cv.imread(‘E:\\fruits.jpg‘) rows,cols = img.shape[:2]
pts1 = np.float32([[56,65],[368,52],[28,387],[389,390]]) pts2 = np.float32([[0,0],[300,0],[0,300],[300,300]])
M = cv.getPerspectiveTransform(pts1,pts2) dst = cv.warpPerspective(img,M,(300,300))
cv.imshow(‘res‘,dst) ##cv.imshow(‘img‘,img)
cv.waitKey(0) cv.destroyAllWindows()
|
·1)图像阀值
分类:简单图像阀值、自适应阀值,Otsu’s二值化
作用:分割,找出不同的物体、目标
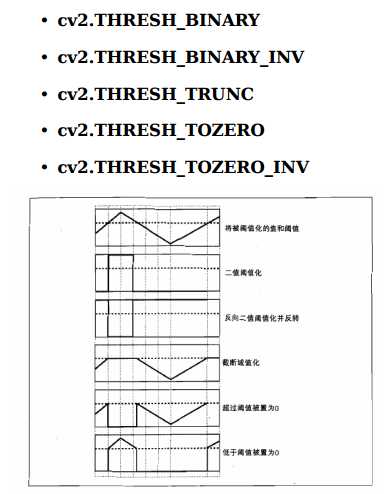
·简单图像阀值(thresh 削峰阀值)
类型:
API
|
Threshold(src, dst, threshold, maxValue, thresholdType) → None Applies a fixed-level threshold to array elements. Parameters: src (CvArr) – Source array (single-channel, 8-bit or 32-bit floating point) dst (CvArr) – Destination array; must be either the same type as src or 8-bit threshold (float) – Threshold value maxValue (float) – Maximum value to use with CV_THRESH_BINARY and CV_THRESH_BINARY_INV thresholding types thresholdType (int) – Thresholding type (see the discussion) |
·自适应阀值
不同部分具有不同的亮度,可以使用自适应阀值
Adapter-Mothod有:
-cv.ADAPTIVE_THRESH_MEAN_C:阀值取自相邻域的平均值
-cv.ADAPTIVE_THRESH_GAUSSIAN_C:阀值取自相邻域的加权和,权重为一个高斯窗口
API:
|
AdaptiveThreshold(src, dst, maxValue, adaptive_method=CV_ADAPTIVE_THRESH_MEAN_C, thresholdType=CV_THRESH_BINARY, blockSize=3, param1=5) → None Applies an adaptive threshold to an array. Parameters: src (CvArr) – Source image dst (CvArr) – Destination image maxValue (float) – Maximum value that is used with CV_THRESH_BINARY and CV_THRESH_BINARY_INV adaptive_method (int) – Adaptive thresholding algorithm to use: CV_ADAPTIVE_THRESH_MEAN_C or CV_ADAPTIVE_THRESH_GAUSSIAN_C (see the discussion) thresholdType (int) – Thresholding type; must be one of CV_THRESH_BINARY xxx CV_THRESH_BINARY_INV xxx blockSize (int) – The size of a pixel neighborhood that is used to calculate a threshold value for the pixel: 3, 5, 7, and so on param1 (float) – The method-dependent parameter. For the methods CV_ADAPTIVE_THRESH_MEAN_C and CV_ADAPTIVE_THRESH_GAUSSIAN_C it is a constant subtracted from the mean or weighted mean (see the discussion), though it may be negative |
代码样例
|
import cv2 as cv import numpy as np from matplotlib import pyplot as plt
img = cv.imread(‘E:\\fruits.jpg‘,0) ##Threshold(src, dst, threshold, maxValue, thresholdType) ret,thresh1 = cv.threshold(img,127,255,cv.THRESH_BINARY) ret,thresh2 = cv.threshold(img,127,255,cv.THRESH_BINARY_INV) ret,thresh3 = cv.threshold(img,127,255,cv.THRESH_TRUNC) ret,thresh4 = cv.threshold(img,127,255,cv.THRESH_TOZERO) ret,thresh5 = cv.threshold(img,127,255,cv.THRESH_TOZERO_INV) ##AdaptiveThreshold(src, dst, maxValue, adaptive_method=CV_ADAPTIVE_THRESH_MEAN_C, thresholdType=CV_THRESH_BINARY, blockSize=3, param1=5) thresh6 = cv.adaptiveThreshold(img,255,cv.ADAPTIVE_THRESH_MEAN_C,cv.THRESH_BINARY,11,2) thresh7 = cv.adaptiveThreshold(img,255,cv.ADAPTIVE_THRESH_GAUSSIAN_C,cv.THRESH_BINARY,11,2)
titles = [‘原图‘,‘二值化‘,‘转置二值化‘,‘截断化‘,‘超过阀值置0化‘,‘低于阀值置0化‘,‘C-均值自适应阀值‘,‘高斯权重-自适应阀值‘] imgs = [img,thresh1,thresh2,thresh3,thresh4,thresh5,thresh6,thresh7] ##使用PLT显示 for i in range(len(imgs)): plt.subplot(3,3,i+1),plt.imshow(imgs[i],cmap = ‘gray‘) plt.title(titles[i]) plt.xticks([]),plt.yticks([])#隐藏坐标
##解决中文不显示问题 plt.rcParams[‘font.sans-serif‘]=[‘SimHei‘] plt.rcParams[‘axes.unicode_minus‘]=False
plt.show() |
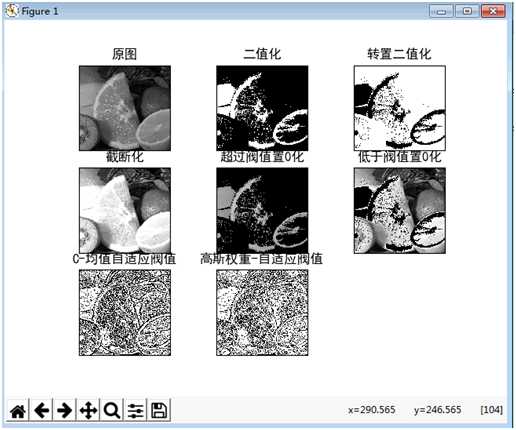
|
对应不同的thresh方法,可采样不同的threshold值,但是,怎么样选取threshold值呢?不同的值得到的不同结果,而那个才是好坏,就要不停去尝试。如果一幅双峰图像,如何选择其中一个峰作为阀值?这时候就需要Otus二值化来自动根据直方图计算出一个阀值
·OTSU 二值化阀值
原理参考:http://www.tuicool.com/articles/uUJFN3f
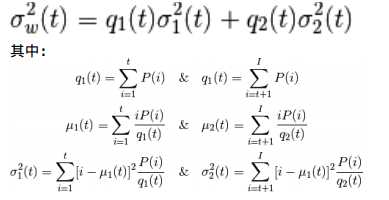
根据权重方差均值等找到一个阀值T,即所谓的自动二值化阀值
算法源码:
例子
|
import cv2 import numpy as np from matplotlib import pyplot as plt img = cv2.imread(‘E:\\fruits.jpg‘,0) # global thresholding ret1,th1 = cv2.threshold(img,127,255,cv2.THRESH_BINARY) # Otsu‘s thresholding ret2,th2 = cv2.threshold(img,0,255,cv2.THRESH_BINARY+cv2.THRESH_OTSU) # Otsu‘s thresholding after Gaussian filtering #(5,5)为高斯核的大小,0 为标准差 blur = cv2.GaussianBlur(img,(5,5),0) # 阈值一定要设为 0! ret3,th3 = cv2.threshold(blur,0,255,cv2.THRESH_BINARY+cv2.THRESH_OTSU) # plot all the images and their histograms images = [img, 0, th1, img, 0, th2, blur, 0, th3] titles = [‘Original Noisy Image‘,‘Histogram‘,‘Global Thresholding (v=127)‘, ‘Original Noisy Image‘,‘Histogram‘,"Otsu‘s Thresholding", ‘Gaussian filtered Image‘,‘Histogram‘,"Otsu‘s Thresholding"] # 这里使用了 pyplot 中画直方图的方法,plt.hist, 要注意的是它的参数是一维数组 # 所以这里使用了(numpy)ravel 方法,将多维数组转换成一维,也可以使用 flatten 方法 #ndarray.flat 1-D iterator over an array. #ndarray.flatten 1-D array copy of the elements of an array in row-major order. for i in range(3): plt.subplot(3,3,i*3+1),plt.imshow(images[i*3],‘gray‘) plt.title(titles[i*3]), plt.xticks([]), plt.yticks([]) plt.subplot(3,3,i*3+2),plt.hist(images[i*3].ravel(),256) plt.title(titles[i*3+1]), plt.xticks([]), plt.yticks([]) plt.subplot(3,3,i*3+3),plt.imshow(images[i*3+2],‘gray‘) plt.title(titles[i*3+2]), plt.xticks([]), plt.yticks([]) plt.show() |
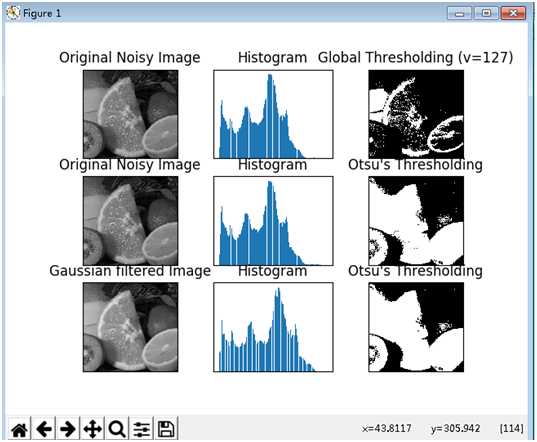
|
标签:运算 分享 imshow int sdn 设置 his 灰度 显示
原文地址:http://www.cnblogs.com/visuangel/p/7097931.html