标签:basic start [] gis fine alt blog auth env
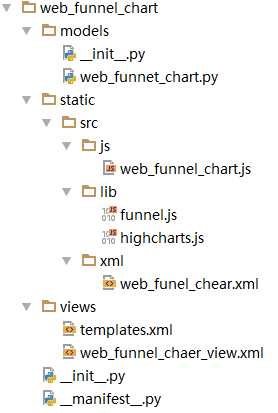
文件架构:

model 文件夹里面主要定义了 数据表 和 读取数据的方法 代码如下:
web_funnet_chart.py:
# -*- coding: utf-8 -*-
from odoo import api,fields,models

class RunChart(models.Model):
    _name = ‘run.chart‘

    sales = fields.Integer()
    prices = fields.Integer()
    sale_date = fields.Date()

    @api.multi
    def get_run_chart_data(self):#获取数据库字段的值
        runCHart_ids = self.env[‘run.chart‘].search([])
        sale_lst = []
        price_lst = []
        date_lst = []
        runCHart_lst = []
        for runCHart in runCHart_ids:
            # leads = self.search_count([(‘sales‘, ‘=‘, sale.sales)])
            sale_lst.append(runCHart.sales)
            price_lst.append(runCHart.prices)
            date_lst.append(runCHart.sale_date)
        runCHart_lst.append((sale_lst,price_lst,date_lst))
        return runCHart_lst
视图的定义放在 \static\src\js\web_funnel_chart.js 这个文件里面
具体代码如下:
/*global Highcharts*/
odoo.define("web_funnel_chart.web_funnel_chart", function(require) {
    "use strict";
    console.log(require)
    var core = require("web.core");
    var dataset = require("web.data");
    var Widget = require("web.Widget");
    var _t = core._t;

    var web_funnel_chart = Widget.extend({
        template: "FunnelChart",
        start: function() {
            var self = this;
            var emp_child = [];
            self.run_chart_dataset = new dataset.DataSetSearch(self, "run.chart", {}, []);
            self.run_chart_dataset.call("get_run_chart_data", [
                []
            ]).done(function(callbacks) {
                Highcharts.chart(‘container‘, { /*  视图在这里开始定义  */
                chart: {
                    zoomType: ‘xy‘
                },
                title: {
                    text: ‘Daily sales and price charts‘
                },
                subtitle: {
                    text: ‘Remarks: basic version of the chart‘
                },
                xAxis: [{
                    categories: callbacks[0][2],
                    crosshair: true
                }],
                yAxis: [{ // Primary yAxis
                    labels: {
                        format: ‘{value} RMB‘,
                        style: {
                            color: Highcharts.getOptions().colors[1]
                        }
                    },
                    title: {
                        text: ‘Price‘,
                        style: {
                            color: Highcharts.getOptions().colors[1]
                        }
                    }
                }, { // Secondary yAxis
                    title: {
                        text: ‘Sales‘,
                        style: {
                            color: Highcharts.getOptions().colors[0]
                        }
                    },
                    labels: {
                        format: ‘{value} Ton‘,
                        style: {
                            color: Highcharts.getOptions().colors[0]
                        }
                    },
                    opposite: true
                }],
                tooltip: {
                    shared: true
                },
                legend: {
                    layout: ‘vertical‘,
                    align: ‘left‘,
                    x: 120,
                    verticalAlign: ‘top‘,
                    y: 100,
                    floating: true,
                    backgroundColor: (Highcharts.theme && Highcharts.theme.legendBackgroundColor) || ‘#FFFFFF‘
                },
                series: [{
                    name: ‘Sales‘,
                    type: ‘column‘,
                    yAxis: 1,
                    data: callbacks[0][0],
                    tooltip: {
                        valueSuffix: ‘ Ton‘
                    }

                }, {
                    name: ‘Price‘,
                    type: ‘spline‘,
                    data: callbacks[0][1],
                    tooltip: {
                        valueSuffix: ‘ RMB‘
                    }
                }]
            });
            });

        },
    });

    core.action_registry.add("web_funnel_chart.funnel", web_funnel_chart);  /*把视图 注册在odoo里面  方便展示

});
\static\src\xml\web_funel_chear.xml 这个具体的作用还不太清楚(后续弄明白再更新)
<?xml version="1.0" encoding="UTF-8"?>
<templates>
    <t t-name="FunnelChart">
        <div id="container">
        </div>
    </t>
</templates>
\views\templates.xml odoo的视图层 这个文件主要是把视图的相关文件与依赖包引进odoo
<?xml version="1.0" encoding="UTF-8"?>
<odoo>
    <template id="assets_backend" name="web_lead_funnel_chart_assets" inherit_id="web.assets_backend">
        <xpath expr="." position="inside">
            <script type="text/javascript"
                    src="/web_funnel_chart/static/src/lib/highcharts.js"/>
            <script type="text/javascript"
                    src="/web_funnel_chart/static/src/lib/funnel.js"/>
            <script type="text/javascript"
                    src="/web_funnel_chart/static/src/js/web_funnel_chart.js"/>
        </xpath>
    </template>
</odoo>
views\web_funnel_chaer_view.xml 把视图显示到odoo上面的一些相关操作定义
<?xml version="1.0" encoding="UTF-8"?>
<odoo>
    <record id="action_funnel_chart" model="ir.actions.client">
        <field name="name">Lead Funnel Chart</field>
        <field name="tag">web_funnel_chart.funnel</field>
    </record>

    <menuitem id="FunnelCHart_main" name="Funnel Chart11"/>

    <menuitem id="menu_FunnelCHart" name="Funnel Chart22" parent="FunnelCHart_main"
              action="action_funnel_chart" />

    <record id="run_chart_tree" model="ir.ui.view">
        <field name="name">RunCHart.tree</field>
        <field name="model">run.chart</field>
        <field name="arch" type="xml">
            <tree>
                <field name="sales" />
                <field name="prices" />
                <field name="sale_date" />
            </tree>
        </field>
    </record>

    <record id="run_chart_form" model="ir.ui.view">
        <field name="name">RunCHart.form</field>
        <field name="model">run.chart</field>
        <field name="arch" type="xml">
            <form>
                <sheet>
                    <group>
                        <field name="sales" />
                        <field name="prices" />
                        <field name="sale_date" />
                    </group>
                </sheet>
            </form>
        </field>
    </record>

    <record id="action_run_chart" model="ir.actions.act_window">
        <field name="name">Run Chart</field>
        <field name="res_model">run.chart</field>
        <field name="view_type">form</field>
        <field name="view_mode">tree,form</field>
    </record>

    <menuitem id="run_chart_main_mune" name="Run Chart"
              parent="FunnelCHart_main" action="action_run_chart"
    />

</odoo>
__manifest__.py 应用的描述文件
# -*- coding: utf-8 -*-
{
    ‘name‘:‘test1‘,
    ‘category‘:‘Web‘,
    ‘author‘:‘Bruce‘,
    ‘depends‘:[],
    ‘data‘: [
        "views/templates.xml",
        "views/web_funnel_chaer_view.xml"
    ],

    ‘qweb‘: [‘static/src/xml/*.xml‘],
    ‘installable‘:True,
    ‘auto_install‘:False,
    ‘application‘:True

}
标签:basic start [] gis fine alt blog auth env
原文地址:http://www.cnblogs.com/brucexl/p/7169135.html