标签:efault length alert htm turn 文件 rem rand 观察
我们有时候需要观察地图 不同地方数据的所在范围和分布密集情况,热力图和聚合点的使用无疑是最好的选择。
1.首先说说百度地图,只做国内的地图可以使用百度地图的海量点和热力图还是蛮好用的。
a.海量点的最大好处是加载很多数据点的情况下不卡顿。
b.如果是画mark在地图上,当点多的时候,会很卡。
c.我之所以用谷歌地图的热力图,是因为我发现百度地图的热力图没有叠加功能,满足不了我的需求。比如说我想了解全国姓张,李,王的人的对比分布,我想要姓张的区域显示红色,姓李的显示蓝色,姓王的显示橙色。这个需求百度地图无法满足我,但是谷歌可以。
2.说说谷歌地图,谷歌地图的热力图我就不说了,https://developers.google.com/maps/documentation/javascript/examples/ 这里面有实例的。
a.谷歌地图支持热力图叠加,但是没有海量点,这一点让我很难过,如果全部画marker的话,数据点太多,加载太卡
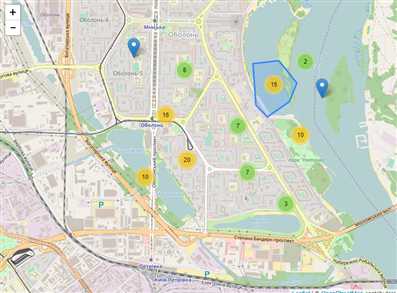
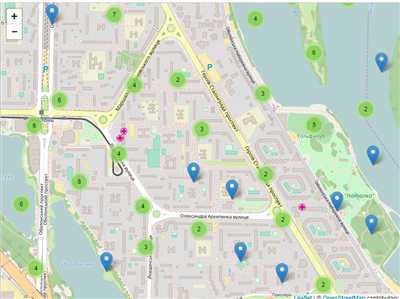
b.这就用到了谷歌聚合点,如图


3.代码实例,主要看看引用了哪些个文件,我是从 https://github.com/Leaflet/Leaflet.markercluster 找到的下载包和实例
<!DOCTYPE html>
<html>
<head>
<title>Leaflet debug page</title>
<link rel="stylesheet" href="https://unpkg.com/leaflet@1.0.3/dist/leaflet.css" integrity="sha512-07I2e+7D8p6he1SIM+1twR5TIrhUQn9+I6yjqD53JQjFiMf8EtC93ty0/5vJTZGF8aAocvHYNEDJajGdNx1IsQ==" crossorigin="" />
<script src="https://unpkg.com/leaflet@1.0.3/dist/leaflet-src.js" integrity="sha512-WXoSHqw/t26DszhdMhOXOkI7qCiv5QWXhH9R7CgvgZMHz1ImlkVQ3uNsiQKu5wwbbxtPzFXd1hK4tzno2VqhpA==" crossorigin=""></script>
<meta name="viewport" content="width=device-width, initial-scale=1.0">
<link rel="stylesheet" href="screen.css" />
<link rel="stylesheet" href="../dist/MarkerCluster.css" />
<link rel="stylesheet" href="../dist/MarkerCluster.Default.css" />
<script src="../dist/leaflet.markercluster-src.js"></script>
</head>
<body>
<div id="map"></div>
<button id="populate">Populate 1 marker</button>
<button id="remove">Remove 1 marker</button>
<script type="text/javascript">
var tiles = L.tileLayer(‘https://{s}.tile.openstreetmap.org/{z}/{x}/{y}.png‘, {
maxZoom: 18,
attribution: ‘© <a href="https://www.openstreetmap.org/copyright">OpenStreetMap</a> contributors‘
}),
latlng = new L.LatLng(50.5, 30.51);
var map = new L.Map(‘map‘, {center: latlng, zoom: 15, layers: [tiles]});
var markers = new L.MarkerClusterGroup();
var markersList = [];
function populate() {
for (var i = 0; i < 100; i++) {
var m = new L.Marker(getRandomLatLng(map));
markersList.push(m);
markers.addLayer(m);
}
return false;
}
function populateRandomVector() {
for (var i = 0, latlngs = [], len = 20; i < len; i++) {
latlngs.push(getRandomLatLng(map));
}
var path = new L.Polyline(latlngs);
map.addLayer(path);
}
function getRandomLatLng(map) {
var bounds = map.getBounds(),
southWest = bounds.getSouthWest(),
northEast = bounds.getNorthEast(),
lngSpan = northEast.lng - southWest.lng,
latSpan = northEast.lat - southWest.lat;
return new L.LatLng(
southWest.lat + latSpan * Math.random(),
southWest.lng + lngSpan * Math.random());
}
markers.on(‘clusterclick‘, function (a) {
alert(‘cluster ‘ + a.layer.getAllChildMarkers().length);
});
markers.on(‘click‘, function (a) {
alert(‘marker ‘ + a.layer);
});
populate();
map.addLayer(markers);
L.DomUtil.get(‘populate‘).onclick = function () {
var bounds = map.getBounds(),
southWest = bounds.getSouthWest(),
northEast = bounds.getNorthEast(),
lngSpan = northEast.lng - southWest.lng,
latSpan = northEast.lat - southWest.lat;
var m = new L.Marker(new L.LatLng(
southWest.lat + latSpan * 0.5,
southWest.lng + lngSpan * 0.5));
markersList.push(m);
markers.addLayer(m);
};
L.DomUtil.get(‘remove‘).onclick = function () {
markers.removeLayer(markersList.pop());
};
</script>
</body>
</html>
标签:efault length alert htm turn 文件 rem rand 观察
原文地址:http://www.cnblogs.com/smilehq/p/7257125.html