标签:route not article pdf 0ms eal ges repr wol
转自:https://blog.cloudflare.com/the-story-of-one-latency-spike/
A customer reported an unusual problem with our CloudFlare CDN: our servers were responding to some HTTP requests slowly. Extremely slowly. 30 seconds slowly. This happened very rarely and wasn‘t easily reproducible. To make things worse all our usual monitoring hadn‘t caught the problem. At the application layer everything was fine: our NGINX servers were not reporting any long running requests.
Time to send in The Wolf.
He solves problems.
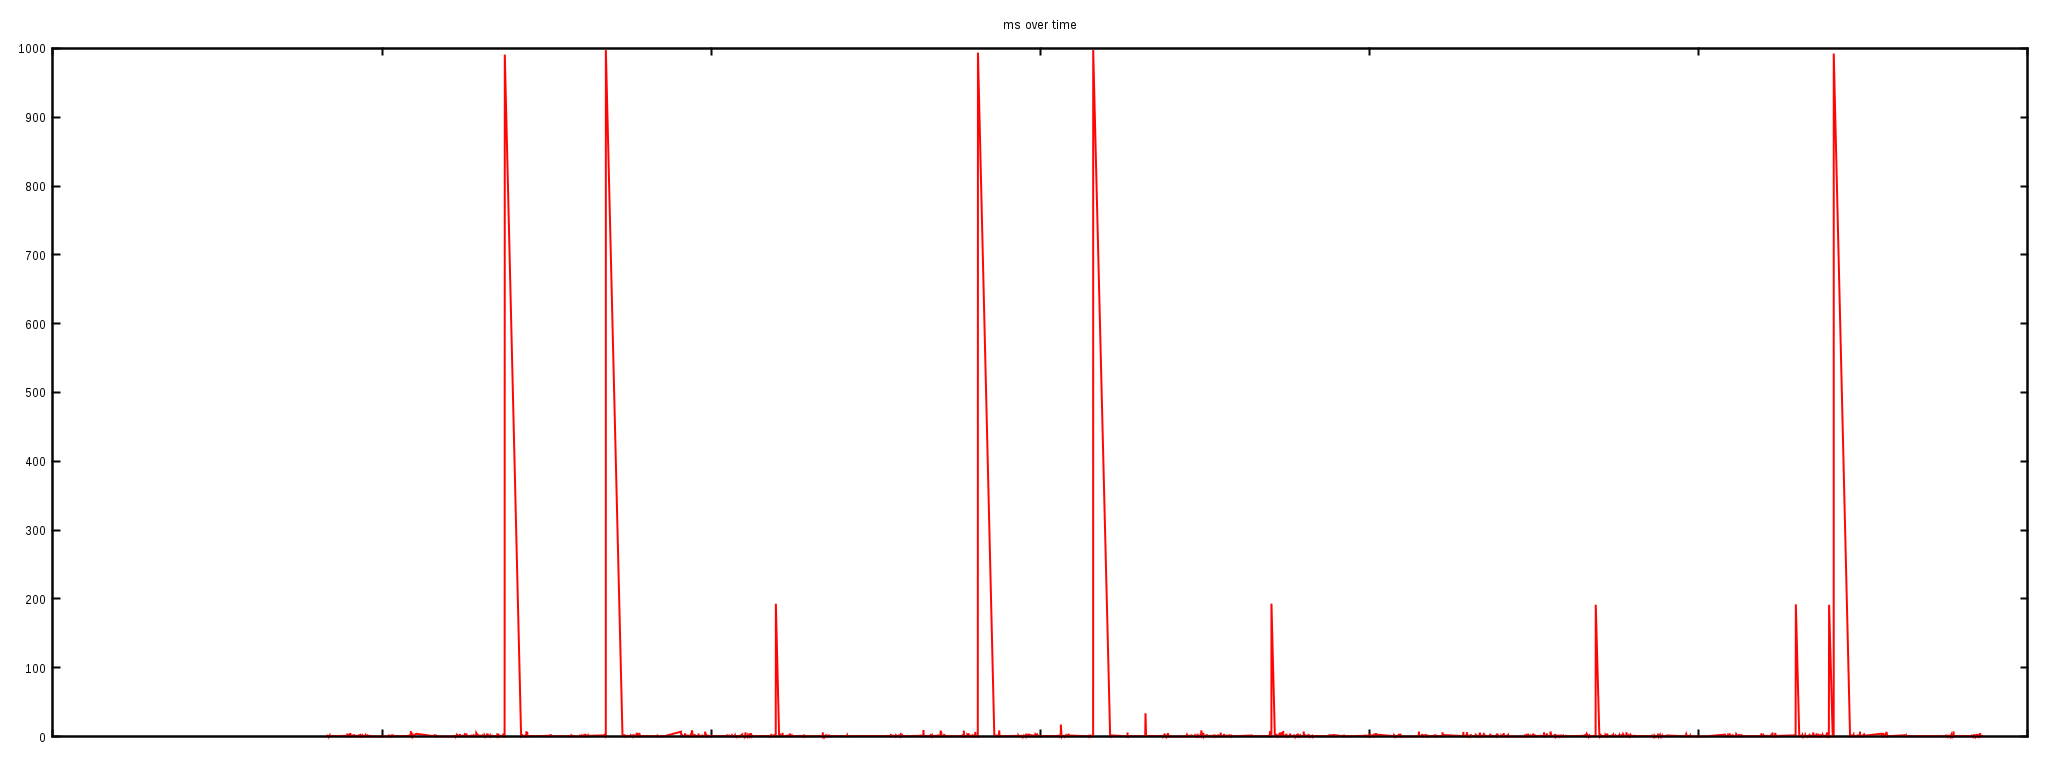
First, we attempted to reproduce what the customer reported—long HTTP responses. Here is a chart of of test HTTP requests time measured against our CDN:

We ran thousands of HTTP queries against one server over a couple of hours. Almost all the requests finished in milliseconds, but, as you can clearly see, 5 requests out of thousands took as long as 1000ms to finish. When debugging network problems the delays of 1s, 30s are very characteristic. They may indicate packet loss since the SYN packets are usually retransmitted at times 1s, 3s, 7s, 15, 31s.
At first we thought the spikes in HTTP load times might indicate some sort of network problem. To be sure we ran ICMP pings against two IPs over many hours.

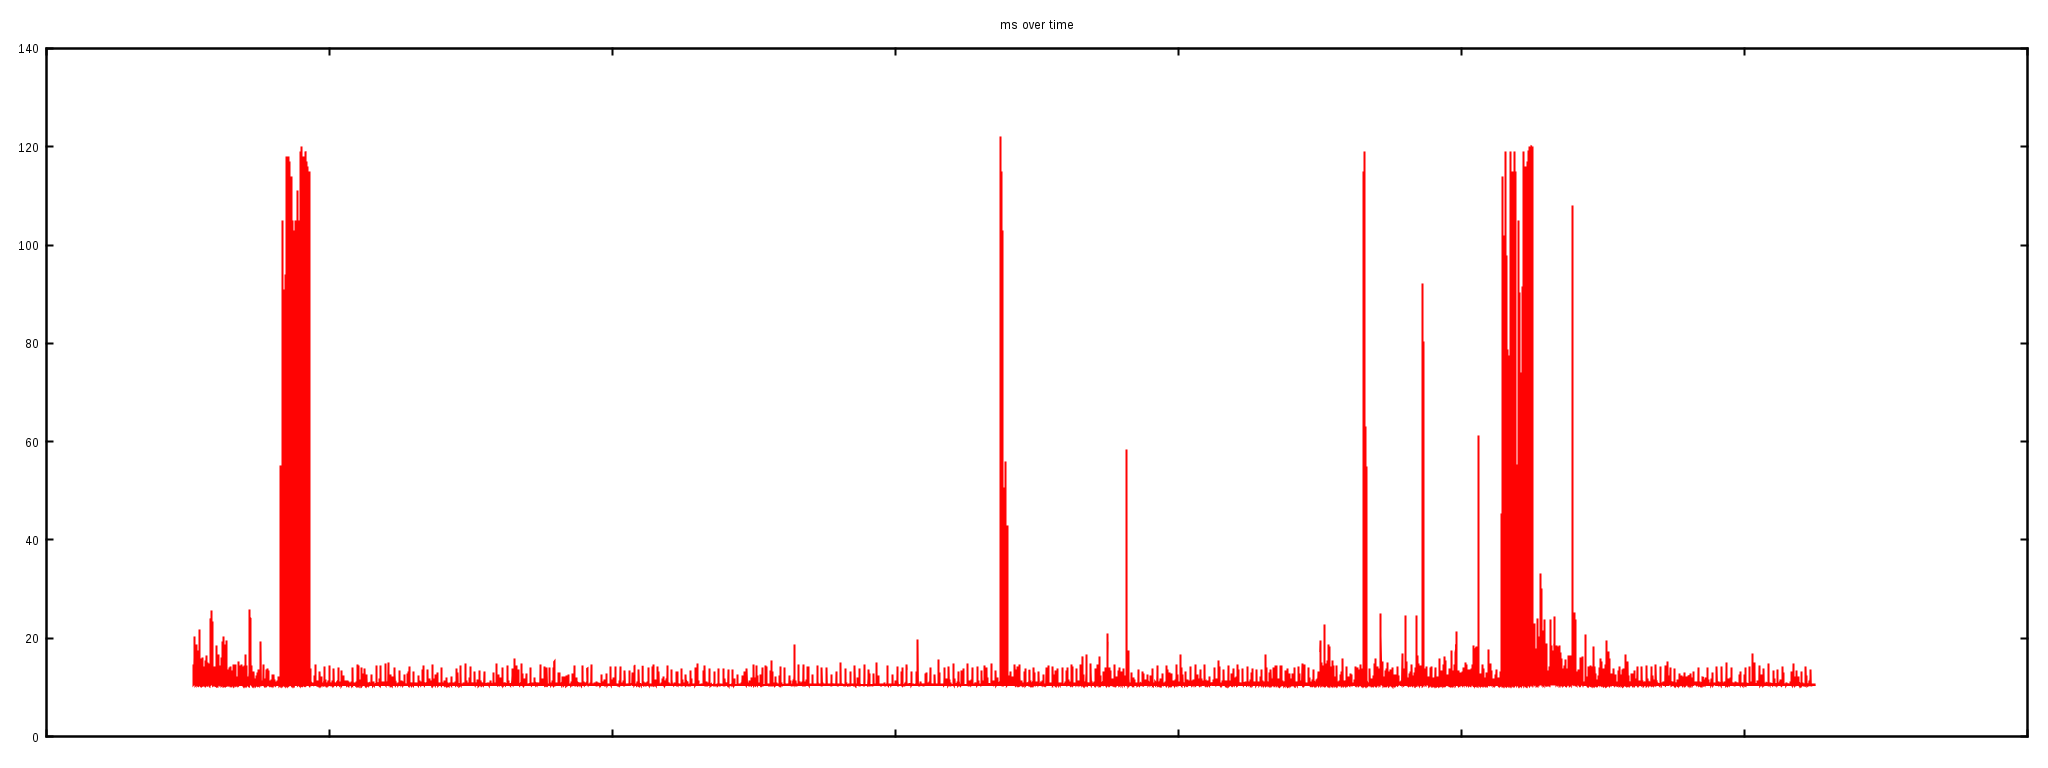
The first "ping" went from an external test machine to the router and showed a flat latency of about 20ms (with the exception of two peaks at about 120ms due to the slowness on the VPS being used to test from):
--- ping statistics ---
114890 packets transmitted, 114845 received, 0% packet loss
rtt min/avg/max/mdev = 10.432/11.025/122.768/4.114 ms

This ~20 ms is a decent round trip time (RTT) for that network and confirms the network connection was in fact stable.
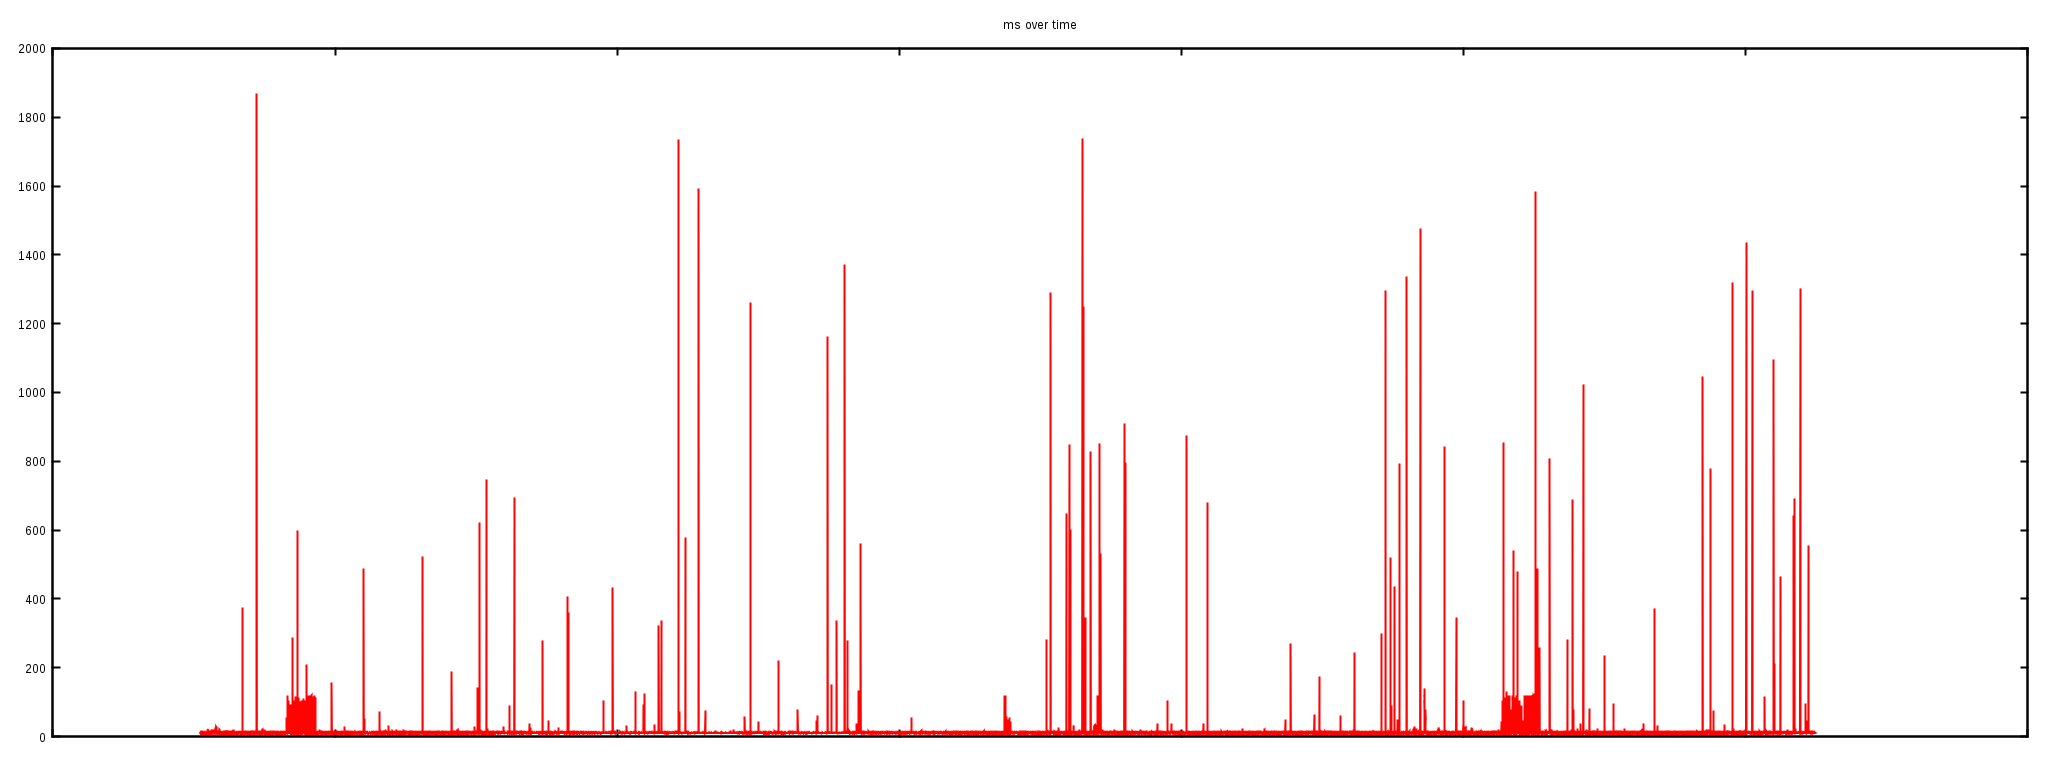
The second "ping" session was launched from our external test machine against one of our Linux servers behind the router:
--- ping statistics ---
114931 packets transmitted, 114805 received, 0% packet loss
rtt min/avg/max/mdev = 10.434/11.607/1868.110/22.703 ms

The "ping" output shows the max RTT being 1.8s. The gigantic latency spikes are also clearly visible on the graph.
The first experiment showed that the network between the external testing server and a router is not malfunctioning. But the second test, against a server just behind this router, revealed awful spikes. This indicates the problem is somewhere between the router and the server inside our datacenter.
To verify the problem we ran a tcpdump on the affected server, trying to pinpoint the particular ICMP packets affected by a spike:
$ tcpdump -ttt -n -i eth2 icmp
00:00.000000 IP x.x.x.a > x.x.x.b: ICMP echo request, id 19283
00:01.296841 IP x.x.x.b > x.x.x.a: ICMP echo reply, id 19283
As you see from this tcpdump output, one particular ICMP packet was indeed received from the network at time 0, but for some reason the operating system waited 1.3s before answering it. On Linux network packets are handled promptly when the interrupt occurs; this delayed ICMP response indicates some serious kernel trouble.
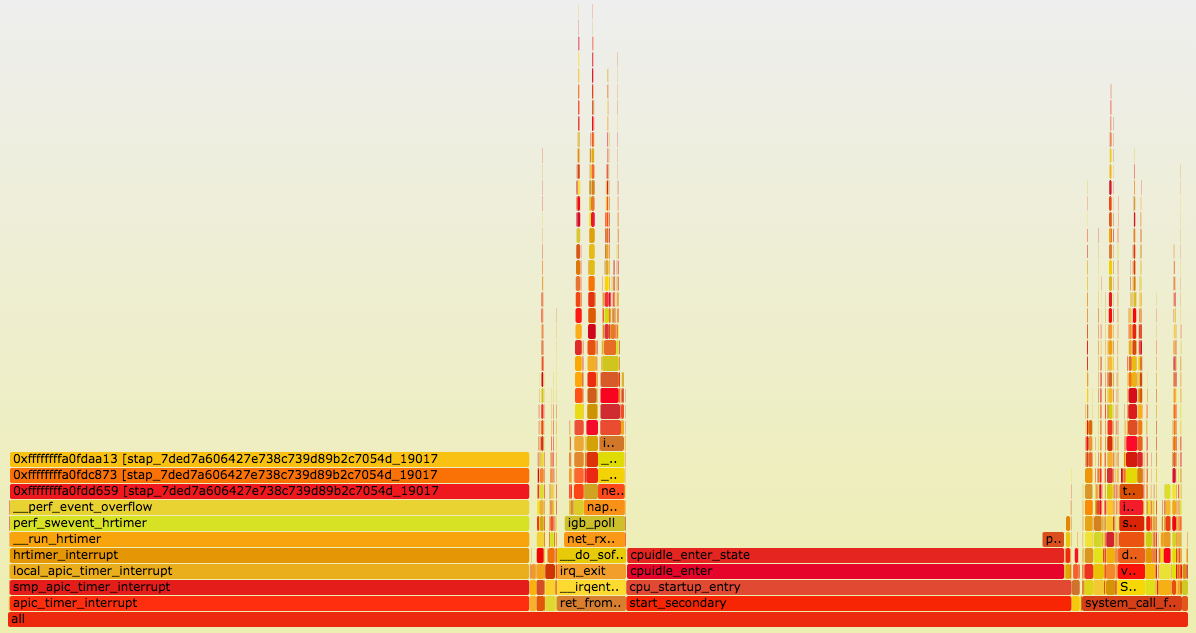
To understand what‘s going on we had to look at the internals of operating system packet processing. Nowadays there are a plethora of debugging tools for Linux and, for no particular reason, we chose System Tap (stap). With a help of a flame graph we identified a function of interest: net_rx_action.
$ ./flame-kernel-global.sh
$ ./stackcollapse-stap.pl out.stap-stacks | ./flamegraph.pl > stap-kernel.svg
The flamegraph itself:

The net_rx_action function is responsible for handling packets in Soft IRQ mode. It will handle up to netdev_budget packets in one go:
$ sysctl net.core.netdev_budget
net.core.netdev_budget = 300
Here is a run of our stap script showing the latency distribution for this function:
$ stap -v histogram-kernel.stp ‘kernel.function("net_rx_action)"‘ 30
Duration min:0ms avg:0ms max:23ms count:3685271
Duration (ms):
value |-------------------------------------------------- count
    0 |@@@@@@@@@@@@@@@@@@@@@@@@@@@@@@@@@@@@@@@@@@@@@  3685011
    1 |                                                   215
    2 |                                                    30
    4 |                                                     9
    8 |                                                     5
   16 |                                                     1
   32 |                                                     0
During a 30s run, we hit the net_rx_action function 3.6 million times. Out of these runs most finished in under 1ms, but there were some outliers. Most importantly one run took an astonishing 23ms.
Having a 23ms stall in low level packet handling is disastrous. It‘s totally possible to run out of buffer space and start dropping packets if a couple of such events get accumulated. No wonder the ICMP packets weren‘t handled in time!
We repeated the procedure a couple more times. That is:
net_rx_action caused the latency spike source.This procedure was pretty effective, and after a couple of runs we identified the culprit: the tcp_collapse function. Here‘s a summary of the latency measurements:
$ stap -v histogram-kernel.stp ‘kernel.function("tcp_collapse")‘ 300
Duration min:0ms avg:3ms max:21ms count:1552
Over 300 seconds there were just about 1,500 executions of the tcp_collapse function. Out of these executions half finished in under 3ms, but the max time was 21ms.
The tcp_collapse function is interesting. It turns out to be deeply intermixed with how the BSD sockets API works. To fully understand it let‘s start with a pub question:
If you set a "receive buffer size" on a TCP socket, what does it actually mean?
Go on, read the man page, dust off your Stevens. I‘ll wait.
The naive answer would go something along the lines of: the TCP receive buffer setting indicates the maximum number of bytes a read() syscall could retrieve without blocking.
While this is the intention, this is not exactly how it works. In fact, the receive buffer size value on a socket is a hint to the operating system of how much total memory it could use to handle the received data. Most importantly, this includes not only the payload bytes that could be delivered to the application, but also the metadata around it.
Under normal circumstances, a TCP socket structure contains a doubly-linked list of packets—the sk_buff structures. Each packet contains not only the data, but also the sk_buffmetadata (sk_buff is said to take 240 bytes). The metadata size does count against the receive buffer size counter. In a pessimistic case—when the packets are very short—it is possible the receive buffer memory is almost entirely used by the metadata.
Using a large chunk of receive buffer space for the metadata is not really what the programmer wants. To counter that, when the socket is under memory pressure complex logic is run with the intention of freeing some space. One of the operations is tcp_collapse and it will merge adjacent TCP packets into one larger sk_buff. This behavior is pretty much a garbage collection (GC)—and as everyone knows, when the garbage collection kicks in, the latency must spike.
There are two ways to control the TCP socket receive buffer on Linux:
setsockopt(SO_RCVBUF) explicitly.tcp_rmem sysctl as a hint.At CloudFlare we use the latter approach and the receive buffer sizes are controlled by a sysctl:
$ sysctl net.ipv4.tcp_rmem
net.ipv4.tcp_rmem = 4096 5242880 33554432
This setting tells Linux to autotune socket receive buffers, and allocate between 4KiB and 32MiB, with a default start buffer of 5MiB.
Since the receive buffer sizes are fairly large, garbage collection could take a long time. To test this we reduced the max rmem size to 2MiB and repeated the latency measurements:
$ sysctl net.ipv4.tcp_rmem
net.ipv4.tcp_rmem = 4096 1048576 2097152

$ stap -v histogram-kernel.stp ‘kernel.function("tcp_collapse")‘ 300
Duration min:0ms avg:0ms max:3ms count:592
Now, these numbers are so much better. With the changed settings the tcp_collapsenever took more than 3ms!
We verified that the net_rx_action latency also improved:
$ stap -v histogram-kernel.stp ‘kernel.function("net_rx_action")‘
Duration min:0ms avg:0ms max:3ms count:3567235
Duration (ms):
value |-------------------------------------------------- count
    0 |@@@@@@@@@@@@@@@@@@@@@@@@@@@@@@@@@@@@@@@@@@@@@  3567196
    1 |                                                    36
    2 |                                                     3
    4 |                                                     0
With the rmem changes the max latency of observed net_rx_action times dropped from 23ms to just 3ms.
Setting the rmem sysctl to only 2MiB is not recommended as it could affect the performance of high throughput, high latency connections. On the other hand reducing rmem definitely helps to alleviate the observed latency issue. We settled with 4MiB max rmem value which offers a compromise of reasonable GC times and shouldn‘t affect the throughput on the TCP layer.
But most importantly, we showed how to use System Tap to debug latency issues. Use our scripts to measure the net_rx_action latency on your system!
Our simple Stap scripts are available on GitHub.
The fixes mentioned in this article have already been rolled out. All our customers should feel just a tiny bit faster :)
If it sounds interesting to work on this type of debugging... we‘re hiring in London, Singapore and San Francisco!
The story of one latency spike
标签:route not article pdf 0ms eal ges repr wol
原文地址:http://www.cnblogs.com/leonxyzh/p/7354292.html