标签:lib 使用 技术 pen ade result conf groups session
# 运行前,请在Rstudio中菜单栏选择“Session - Set work directory -- Choose directory”,弹窗选择之前分析目录中的result文件夹

# 安装相关软件包,如果末安装改为TRUE运行即可安装
if (FALSE){
    source("https://bioconductor.org/biocLite.R")
    biocLite(c("ggplot2"))
}

# 加载相关软件包
library("ggplot2") # load related packages

# 读入实验设计和Alpha多样性值
design = read.table("design.txt", header=T, row.names= 1, sep="\t")
alpha = read.table("alpha.txt", header=T, row.names= 1, sep="\t")

# 以Observed OTU为例进行可视化和统计分析,其它指数将observed_otus替换为shannon, chao1, PD_whole_tree即可计算

# 合并Alpha指数与实验设计
index = cbind(alpha, design[match(rownames(alpha), rownames(design)), ])
# 绘图代码、预览、保存PDF
p = ggplot(index, aes(x=genotype, y=observed_otus, color=genotype))+
  geom_boxplot(alpha=1, outlier.size=0, size=0.7, width=0.5, fill="transparent") +
  geom_jitter( position=position_jitter(0.17), size=1, alpha=0.7)+
  labs(x="Groups", y="observed_otus index")
p
ggsave(paste("alpha_observed_otus.pdf", sep=""), p, width = 5, height = 3)

# 统计组间是否显著差异
# anova对指数与分组统计
observed_otus_stats <- aov(observed_otus ~ genotype, data = index)
# 使用TukeyHSD对组间进行检验,效正pvalue
Tukey_HSD_observed_otus <- TukeyHSD(observed_otus_stats, ordered = FALSE, conf.level = 0.95)
# 结果中提取需要的结果
Tukey_HSD_observed_otus_table <- as.data.frame(Tukey_HSD_observed_otus$genotype)
# 预览结果
Tukey_HSD_observed_otus_table
# 保存结果到文件,按Pvaule值由小到大排序
write.table(Tukey_HSD_observed_otus_table[order(Tukey_HSD_observed_otus_table$p, decreasing=FALSE), ], file="alpha_observed_otus_stats.txt",append = FALSE, quote = FALSE, sep="\t",eol = "\n", na = "NA", dec = ".", row.names = TRUE,col.names = TRUE)
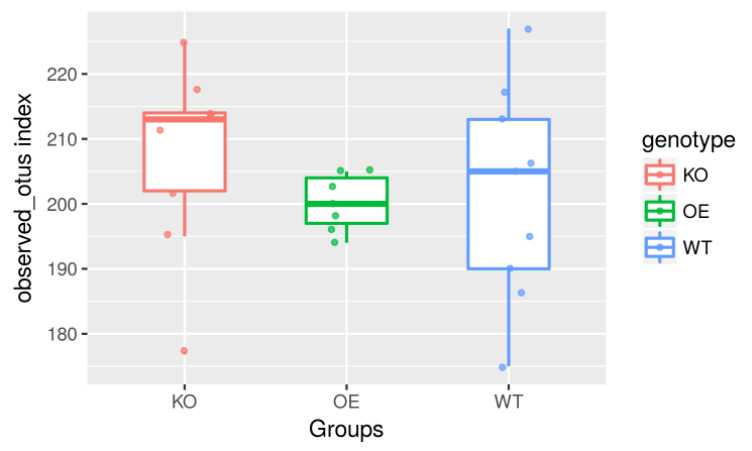
各组间的统计结果如下:主要看最后一列p adj(Adjust P-value)是否显著,本文数据不显著
diff    lwr     upr     p adj
OE-KO   -7.52380952380952       -24.480725165752        9.43310611813294        0.515429907536906
WT-KO   -6.11111111111111       -21.9728532782553       9.75063105603303        0.604309699204896
WT-OE   1.4126984126984 -15.5442172292441       18.3696140546409        0.976169656924344
标签:lib 使用 技术 pen ade result conf groups session
原文地址:http://www.cnblogs.com/freescience/p/7420426.html