标签:doc log required play apache服务 ... 拷贝 range 代码
一、开启GD库
Jpgraph需要GD库的支持,所以在调式JpGraph之前,确保GD库已开启,这很重要,不然后面的工作就没办法展开了。GD库在PHP5中是被默认安装的,我们只需开启GD库就可以了。
打开php.ini文件,找到“;extension=php_gd2.dll”选项,将其前的分号“;”去掉,如图所示
然后保存修改后的文件并重新启动apache服务器。可以通过phpinfo()函数来获取GD2函数库的安装信息,验证GD库是否安装成功。
二、使用方法
在使用JpGraph时,最好弄明白你使用的是哪一个版本,千万不要弄错,不然就会张冠李戴,让你调得头晕目眩的。也不要从网上找一些片断代码来调试,除非它是完整的,不然也会让你吃不了兜着走的了。唠叼就到这里了,下面开始调试。
JpGraph版本 jpgraph-3.5.0b1(点击这里下载或者到官网http://jpgraph.net/download/下载)
解压下载的jpgraph-3.5.0b1压缩包,会看到一些目录:
src:图表生成所依赖的代码包,其子目录Examples里有许多的实例。
src\Examples:里面包函许多实例,使用它们可以制作各种各样的图表
docs :jpgraph的开发文档,但全是英文的.。
docs\chunkhtml:里面有许多案例及附有图表,通过它我们可以参考一下我们所需要的图表。
在网站根目录建一个文件夹test,然后把把docs和src文件夹拷贝到前面所创建的目录test里,重命名src为jpgraph,这里因为Examples里面的实例文件加载的路径都是“require_once (‘jpgraph/jpgraph.php‘);”
实例
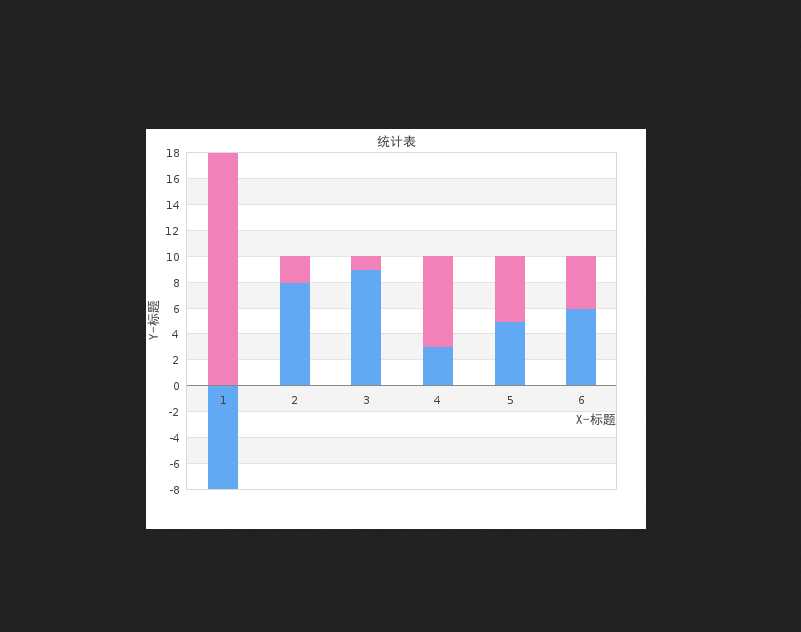
把jpgraph\Examples\accbarex1.php拷贝到test目录(和jpgraph同一目录),然后打开打开http://localhost/test/accbarex1.php,我们就会看到生成的图

代码如下:
<?php
//加载生成图表对应的文件
require_once (‘jpgraph/jpgraph.php‘);
require_once (‘jpgraph/jpgraph_bar.php‘);
//创建图表的数据,可以自定义
$data1y=array(-8,8,9,3,5,6);
$data2y=array(18,2,1,7,5,4);
//图表的长宽
// Create the graph. These two calls are always required
$graph = new Graph(500,400);
$graph->SetScale("textlin");
$graph->SetShadow();
//图表的外边距
$graph->img->SetMargin(40,30,20,40);
// Create the bar plots
$b1plot = new BarPlot($data1y);
$b1plot->SetFillColor("orange");
$b1plot->value->Show();
$b2plot = new BarPlot($data2y);
$b2plot->SetFillColor("blue");
$b2plot->value->Show();
// Create the grouped bar plot
$gbplot = new AccBarPlot(array($b1plot,$b2plot));
// ...and add it to the graPH
$graph->Add($gbplot);
//设置图表的标题字体、大小
// $graph->title->Set("Accumulated bar plots");
// $graph->xaxis->title->Set("X");
// $graph->yaxis->title->Set("Y");
$graph->title->Set(iconv("UTF-8","GB2312//IGNORE","统计表"));
$graph->xaxis->title->Set(iconv("UTF-8","GB2312//IGNORE","X-标题"));
$graph->yaxis->title->Set(iconv("UTF-8","GB2312//IGNORE","Y-标题"));
$graph->title->SetFont(FF_SIMSUN,FS_BOLD);
$graph->yaxis->title->SetFont(FF_SIMSUN,FS_BOLD);
$graph->xaxis->title->SetFont(FF_SIMSUN,FS_BOLD);
//和上面标题对应,设置标题的字体和大小
// $graph->title->SetFont(FF_FONT1,FS_BOLD);
// $graph->yaxis->title->SetFont(FF_FONT1,FS_BOLD);
// $graph->xaxis->title->SetFont(FF_FONT1,FS_BOLD);
//生成本地图表,黙认留空,生成在当前目录,可以Stroke(“路径/文件名.png”)这样指定路径
// Display the graph
$graph->Stroke();
?>
原文来自 http://www.cnblogs.com/tdalcn/p/6385403.html。
标签:doc log required play apache服务 ... 拷贝 range 代码
原文地址:http://www.cnblogs.com/Chrisevelyn/p/7449723.html