码迷,mamicode.com
首页 > 其他好文 > 详细

echarts的相关配置--柱状图

时间:2017-08-30 15:36:49      阅读:213      评论:0      收藏:0      [点我收藏+]

标签:log   class   提示框   分享   grid   logs   axis   chart   数据   

代码示例:

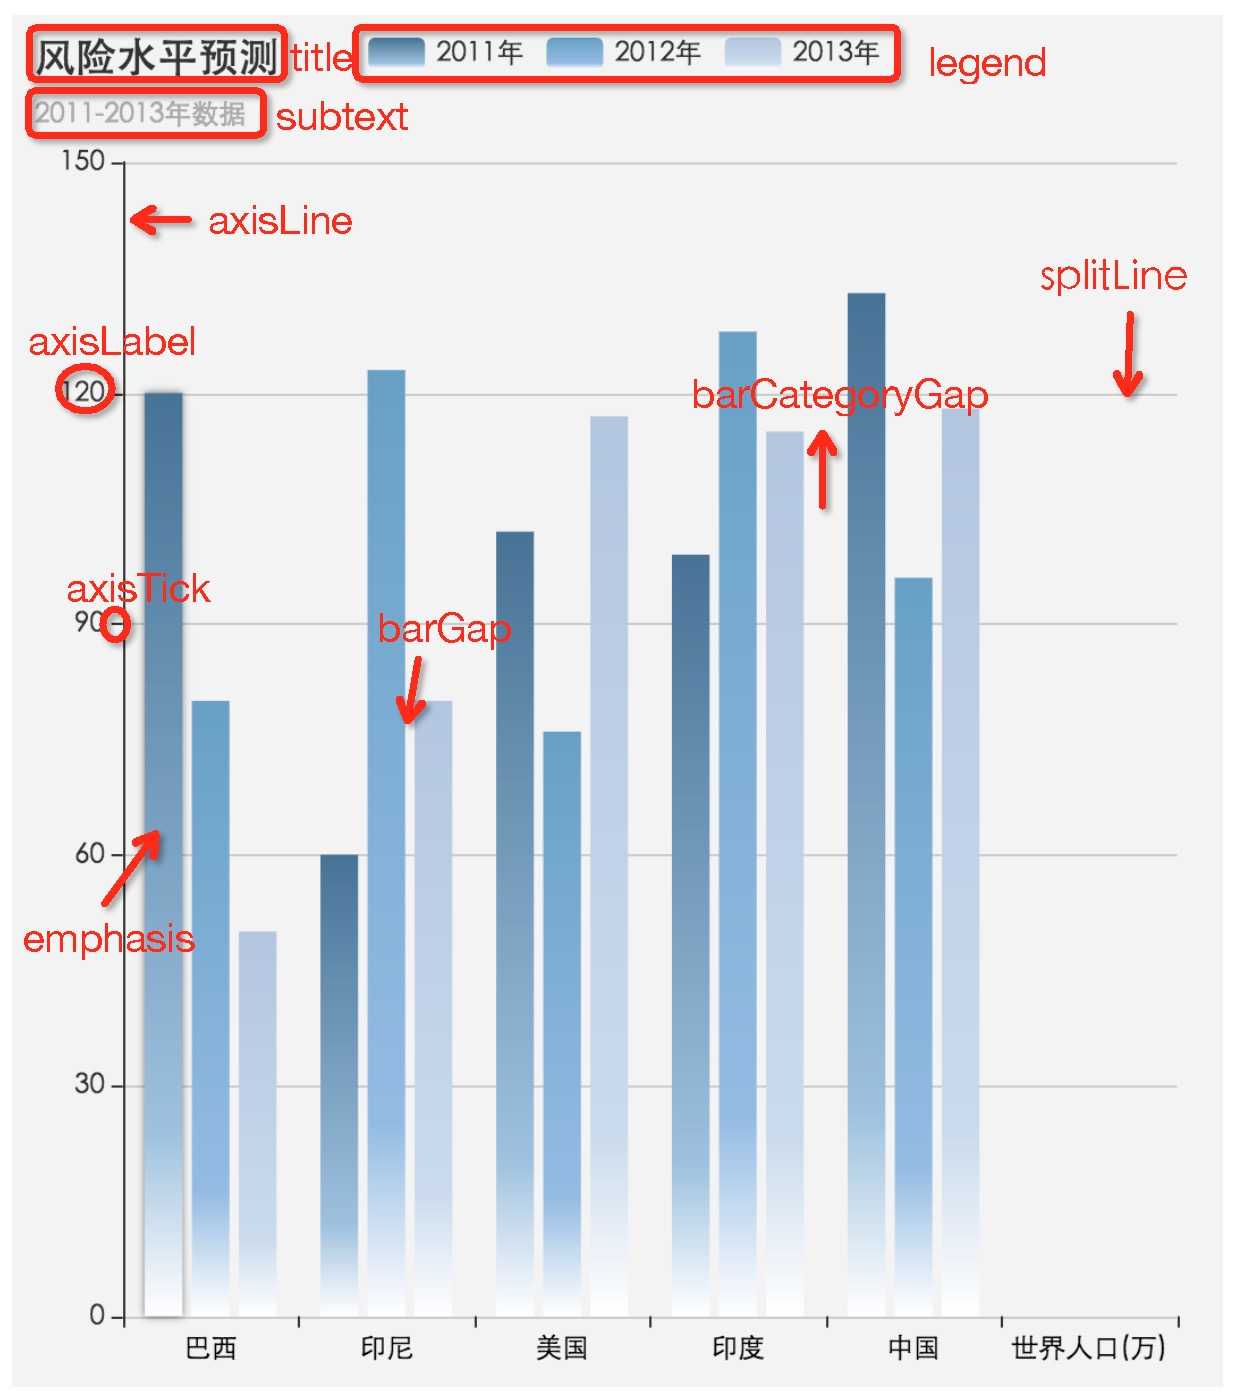
  1 var option = {
  2                     title: {
  3                         text: ‘风险水平预测‘ ,             //图表主标题
  4                         subtext:‘2011-2013年数据‘    //图表副标题
  5                     },
  6                     legend:{                         //条形图的参数
  7                         data:[‘2011年‘,‘2012年‘,‘2013年‘],
  8                         align: ‘left‘,
  9                         rightt: 10
 10                     },
 11                     barGap:‘25%‘,                 //单个柱状图之间的间隙
 12                     barCategoryGap:‘25%‘,    //每组柱状图之间的间隙
 13                     tooltip: {                  //柱状图的tooltip提示框
 14                         show:true,     
 15                         trigger: ‘axis‘,
 16                         axisPointer: {
 17                             type: ‘shadow‘
 18                         }
 19                     },
 20                     grid: {                     //图表的显示位置
 21                         left: ‘3%‘,
 22                         right: ‘4%‘,
 23                         bottom: ‘3%‘,
 24                         containLabel: true
 25                     },
 26                     xAxis: {                 //x轴的配置
 27                         axisLabel:{        //x轴的刻度值
 28                             show:true,
 29                             textStyle: {    //设置刻度值的颜色
 30                                 color: ‘#000‘
 31                             }
 32                         },
 33                         axisLine:{         //x轴的轴线
 34                             show:true
 35                         },
 36                         axisTick:{         //x轴的刻度线
 37                             show:true
 38                         },
 39                         splitLine:{         //x轴的网格线
 40                             show:false
 41                         },
 42                         type: ‘category‘,  
 43                         data: [‘巴西‘,‘印尼‘,‘美国‘,‘印度‘,‘中国‘,‘世界人口(万)‘]     //x轴刻度值的数据
 44                     },
 45                     yAxis: {                 //y轴的配置
 46                         axisLabel:{        //y轴的刻度值
 47                             show:true
 48                         },
 49                         axisLine:{        //y轴的轴线
 50                             show:true
 51                         },
 52                         axisTick:{        //y轴的刻度线
 53                             show:true
 54                         },
 55                         splitLine:{       //y轴的网格线
 56                             show:true
 57                         },
 58                         type: ‘value‘,
 59                         boundaryGap: [0, 0.01]
 60                     },
 61                     series: [
 62                         {
 63                             name: ‘2011年‘,
 64                             type: ‘bar‘,
 65                             data: [120,60,102,99,133 ],    //柱状图的值
 66                             itemStyle:{
 67                                 normal:{
 68                                     color:  new echarts.graphic.LinearGradient(   //柱状图的颜色,此处为渐变色
 69                                         0, 1, 0, 0,
 70                                         [
 71                                             {offset: 1, color: ‘#477397‘},
 72                                             {offset: 0.2, color: ‘#9dc1de‘},
 73                                             {offset: 0, color: ‘#fff‘}
 74 
 75                                         ]
 76                                     )
 77                                 },
 78                                 emphasis: {       //鼠标hover到条形图上条形图的显示状态
 79                                     barBorderWidth: 1,  
 80                                     shadowBlur: 10,
 81                                     shadowOffsetX: 0,
 82                                     shadowOffsetY: 0,
 83                                     shadowColor: ‘rgba(0,0,0,0.5)‘
 84                                 }
 85                             }
 86                         },
 87                         {
 88                             name: ‘2012年‘,
 89                             type: ‘bar‘,
 90                             data: [80,123,76,128,96 ],
 91                             itemStyle:{
 92                                 normal:{
 93                                     color:  new echarts.graphic.LinearGradient(
 94                                         0, 1, 0, 0,
 95                                         [
 96                                             {offset: 1, color: ‘#68a0c5‘},
 97                                             {offset: 0.2, color: ‘#94bce3‘},
 98                                             {offset: 0, color: ‘#fff‘}
 99 
100                                         ]
101                                     )
102                                 },
103                             }
104                         },
105                         {
106                             name: ‘2013年‘,
107                             type: ‘bar‘,
108                             data: [50, 80,117,115,118],
109                             itemStyle:{
110                                 normal:{
111                                     color: new echarts.graphic.LinearGradient(
112                                         0, 1, 0, 0,
113                                         [
114                                             {offset: 1, color: ‘#b3c6e0‘},
115                                             {offset: 0.2, color: ‘#cadbed‘},
116                                             {offset: 0, color: ‘#fff‘}
117 
118                                         ]
119                                     )
120                                 },
121                             }
122                         }
123                     ]
124                 };     


以上代码的效果图如下:

 技术分享


echarts的相关配置--柱状图

标签:log   class   提示框   分享   grid   logs   axis   chart   数据   

原文地址:http://www.cnblogs.com/IvyXia/p/7448463.html

(0)
(0)
   
举报
评论 一句话评论(0
登录后才能评论!
© 2014 mamicode.com 版权所有  联系我们:gaon5@hotmail.com
迷上了代码!