标签:col normal stp sea hex rand 集中 com white
一、
x = np.random.normal(size=100) #随机生成100个高斯分布的数据(均值为0,方差为1)
sns.distplot(x,kde=False) #绘制直方图(自动设定轴的区间)
#kde=False表示不画出拟合曲线,kde=True表示同时画出拟合曲线
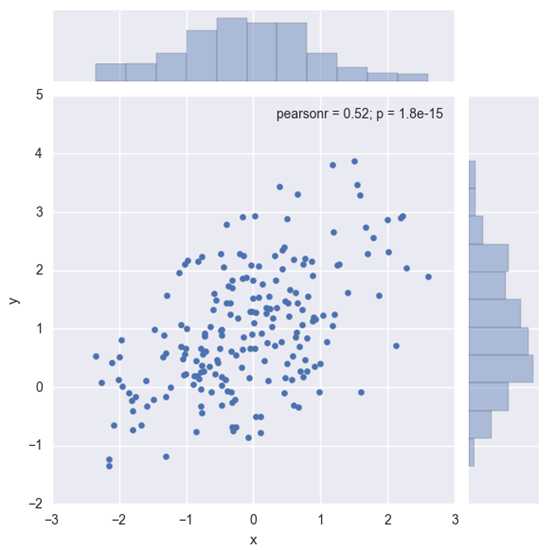
二、根据均值和协方差生成数据
mean, cov = [0, 1], [(1, .5), (.5, 1)] #指定均值和协方差
data = np.random.multivariate_normal(mean, cov, 200) #生成数据
df = pd.DataFrame(data, columns=["x", "y"])
#观测两个变量之间的分布关系最好用散点图
sns.jointplot(x="x", y="y", data=df);

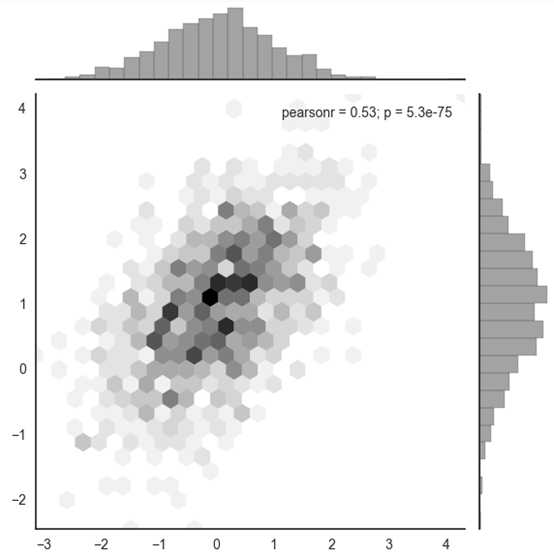
查看数据在那些区域比较集中:利用hex图
x, y = np.random.multivariate_normal(mean, cov, 1000).T
with sns.axes_style("white"):
sns.jointplot(x=x, y=y, kind="hex", color="k")

三、
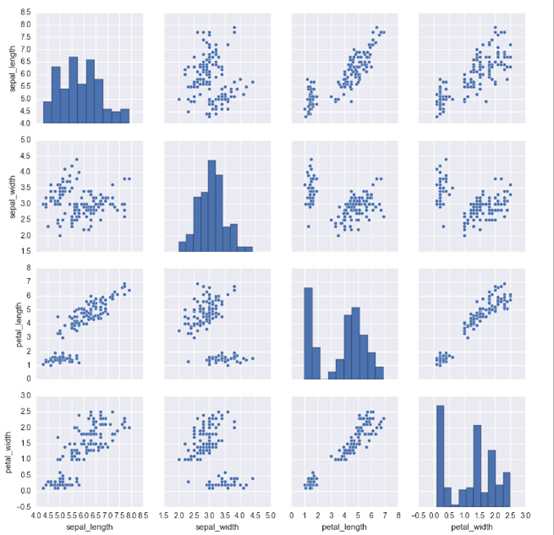
iris = sns.load_dataset("iris") #iris是一组内置的数据集,有四种特征
sns.pairplot(iris) #特征和特征之间的分布情况(多特征)

标签:col normal stp sea hex rand 集中 com white
原文地址:http://www.cnblogs.com/wqpkita/p/7457147.html